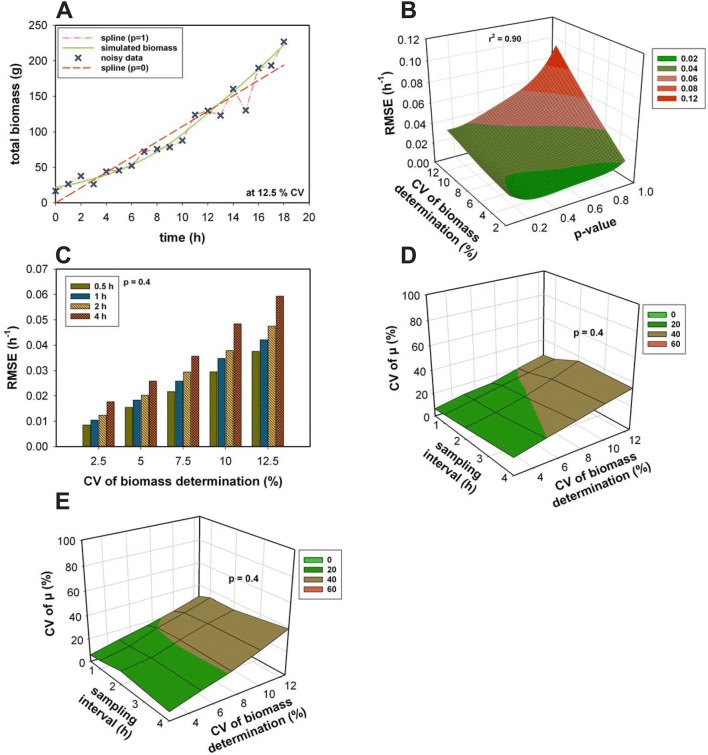
Fig. 3.
a Spline fittings with p 0 and 1 of noisy biomass data (12.5% CV of biomass determination). b RMSE as a function of the sampling interval, the CV of biomass determination and the fitting parameter p of the spline function. c RMSE at a p of 0.4 at different sampling intervals. The coefficient of variation (CV) of the growth rate for the Monod model (d) and the non-competitive model (e) as a function of the sampling interval and CV of biomass determination for a fitting parameter p of 0.4. For b–e the number of simulated processes n = 100

