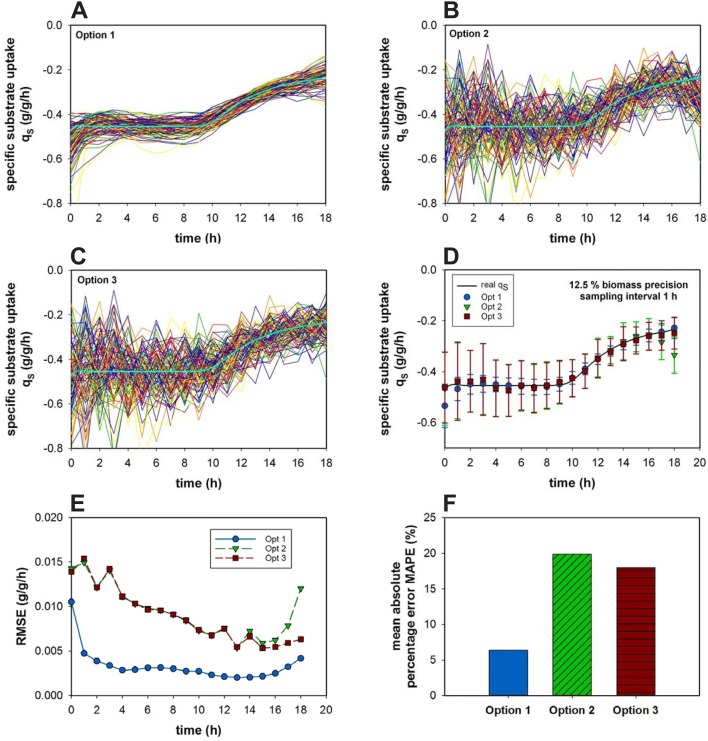
Fig. 5.
Specific substrate uptake rate estimation via option 1 (a) 2 (b) and 3 (c) over the time course of a fed-batch (n = 100) for a sampling interval of 1 h and precision of 12.5% CV for the biomass determination are presented. The averaged values and their respective standard deviations of the three different options over the time course of the process (d), the resulting RMSE values for each option and sampling point (e), and MAPE for all three options (f) are displayed. The number of simulated processes n = 100

