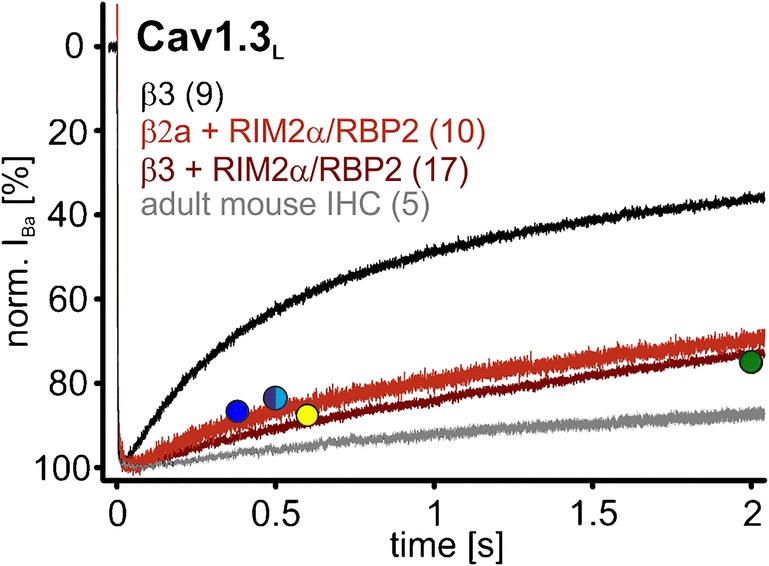
Fig. 13.

Comparison of RIM2α/RBP2-stabilized Cav1.3LIBa inactivation (β3 and β2a; tsA-201 cells) with IBa VDI measured in IHCs. Mean IBa (15 mM) traces of Cav1.3L/α2δ1 with β3 (black), β3/RIM2α/RBP2 (dark red), or β2a/RIM2α/RBP2 (red) during the first 2 s of a depolarization to Vmax. For comparison, we recorded IBa in mature mouse IHCs measured as recently described [53] in mature mouse IHCs (mean IBa trace from 5 individual recordings; gray; 10 mM Ba2+). Circles indicate the remaining Ba2+ current at the indicated time points recorded from IHCs taken from previously published papers: [33] (dark blue; 10 mM Ba2+, mouse P20); [42] (turquoise; 5 mM Ba2+, mouse P40–70); [9] (purple; 5 mM Ba2+, mouse 2–4 weeks); [24] (yellow; 5 mM Ba2+, gerbil P50); [34] (green; 20 mM Ba2+, chicken 1–21 days). Turquoise and purple circles are overlapping and are therefore shown together as half-filled circle
