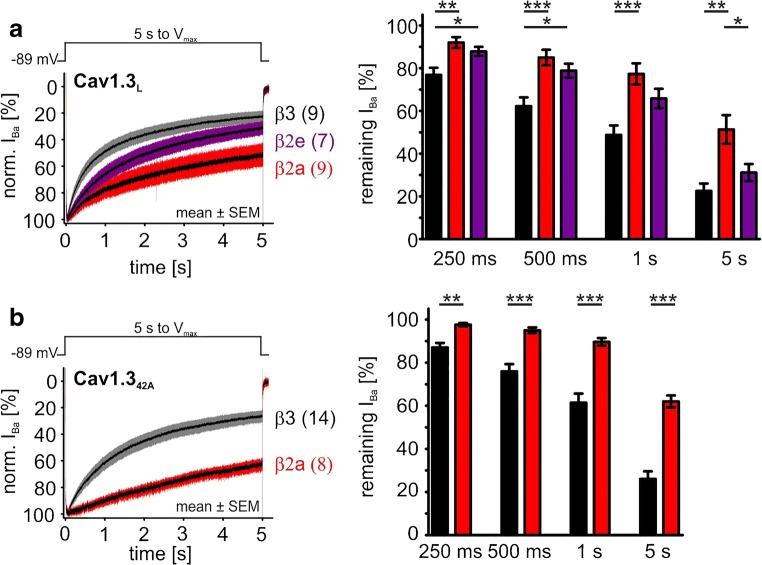
Fig. 7.
Modulation of VDI by β3 and different β2 subunit splice variants (15 mM Ba2+). a, b Left panels: mean (± SEM) IBa traces for Cav1.3L/α2δ1 (a) or Cav1.342A/α2δ1 (b) co-expressed with either β3 (black/gray), β2a (red), or β2e (purple). The number of individual recordings is indicated in parentheses. VDI was quantified using 15 mM Ba2+ as charge carrier and calculated as residual IBa at the indicated predefined time points (bar graphs). Statistical significance was determined using one-way ANOVA with Bonferroni post hoc test (a) or unpaired Student’s t test (b): ***p < 0.001; **p < 0.01; *p < 0.05. For detailed statistics, see Table 2

