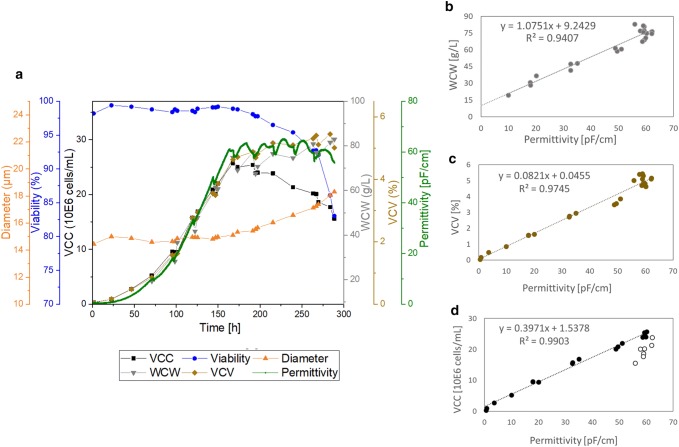
Fig. 2.
Overall cultivation results of the STR2000 cultivation of process A. Top a: time-dependent cultivation results for cell diameter, cell viability, viable cell concentration (VCC), wet cell weight (WCW), viable cell volume (VCV), and online permittivity signal. Bottom: correlation of the permittivity signal with WCW (b), VCV (c), and VCC (d). Full circles in d represent the data points incorporated into the linear regression model (up to peak VCC) and empty circles represent the values excluded from the linear regression (stationary and apoptotic cell growth phase)

