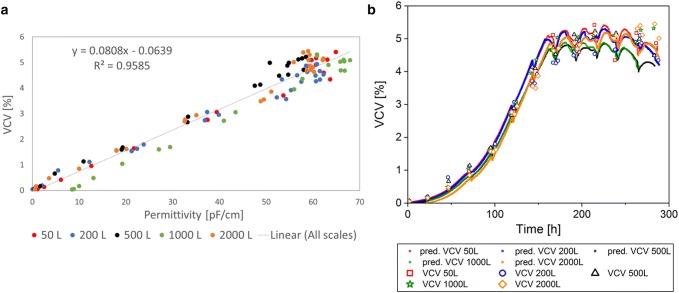
Fig. 4.
Linear regression model of permittivity and viable cell volume (VCV) for Process A, including all cultivations from 50 L up to 2000 L bioreactor volume (a). Predictions (pred.) based on the online permittivity signal for all bioreactor scales using the equation from the linear regression (b)

