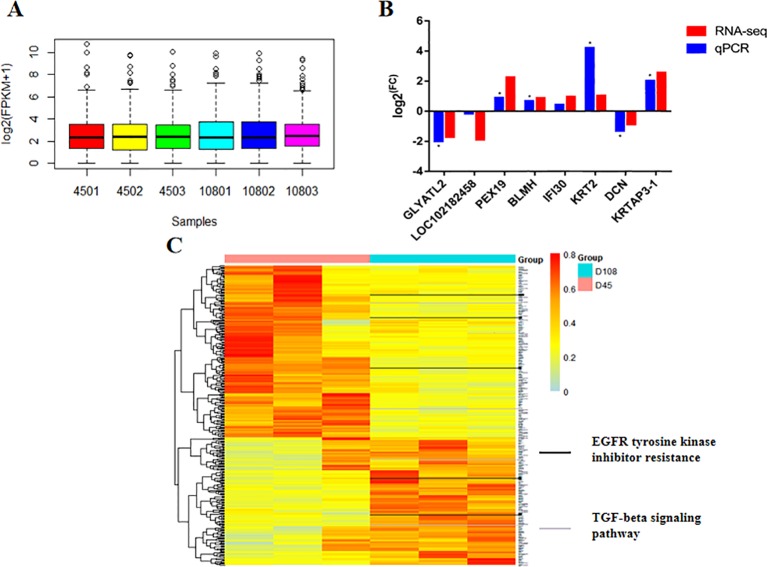
Figure 2.
The transcriptional profile of two groups during early hair growth. (A) Averaged RNA expression level among six individuals. (B) Validation of selected differently expressed genes (DEGs) through real-time quantitative PCR. The value is presented as the logarithmic form of the fold change (FC) between two groups. P values were calculated using Student’s t tests (*P < 0.05). (C) Clustered heatmap representation of DEG expression. Clustering was performed according to Pearson’s correlation values. The black and gray bars outlined in the picture represent the DEGs that are involved in epidermal growth factor receptor tyrosine kinase inhibitor resistance and transforming growth factor beta signaling pathways, respectively.

