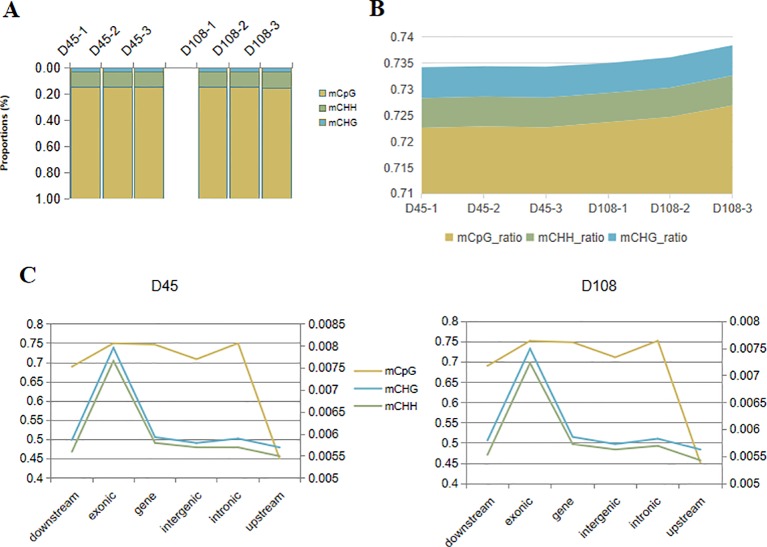
Figure 4.
DNA methylation profiles of skin samples in shift stages in the wool shape of Zhongwei goats. (A) The proportion of methylated cytosines (mCs) (mCpG, mCHH, and mCHG) in the D45 and D108 tissue samples. (B) The average methylation level (%) of cytosine sites [CpG, CHH, and chlorhexidine gluconate (CHG)] in six individual samples. (C) The methylation level (%) of three mCs in different genomic regions or elements. The vertical axis on the left represents the methylation levels of CpG in two stages, and the values on the right axis represents methylation levels of CHG and CHH.

