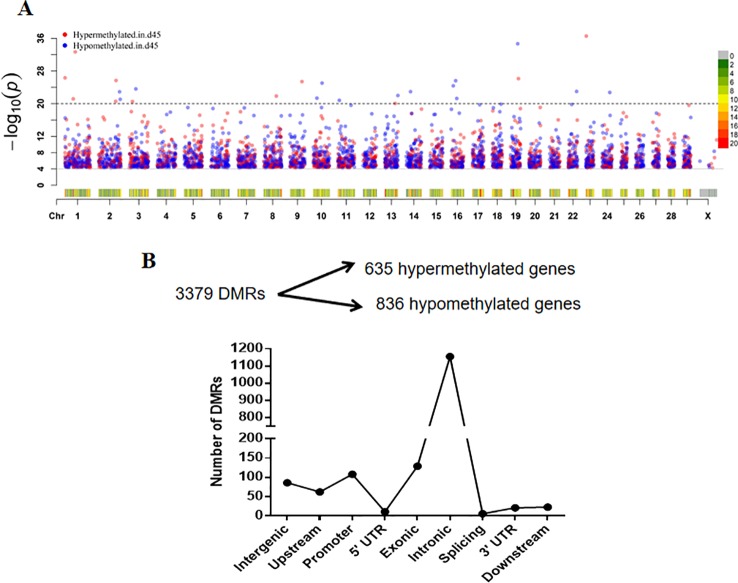
Figure 5.
Distribution of differentially methylated regions (DMRs) in different categories. (A) Manhattan plot of DMRs in a chromosomal landscape. Dots above the dotted line presented DMRs with –log10 (p) > 20. The heatmap below the dots represents the density (counts) of the DMR distribution within chromosomes. The blue and red dots indicate the status of hypomethylation and hypermethylation in the D45 regions, respectively. (B) The filtration of differentially methylated genes and the number of DMRs in different genomic regions.

