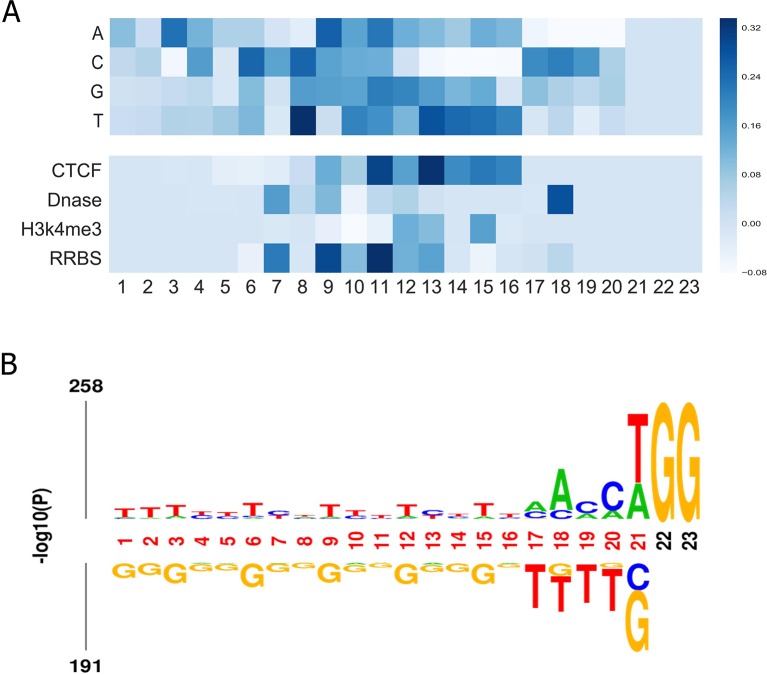
Figure 5.
(A) Visualization of the importance of different nucleotides and epigenetic features at different positions for our model trained on the benchmark dataset. The colors represent the contribution of the position-specific nucleotides to determining an efficient gRNA. The x-axis shows the positions of the nucleotide in the sequence. The y-axis lists all possible nucleotides. This representation also applies to. (B) Preference of nucleotide sequences that impact CRISPR/Cas9 gRNAs activity.

