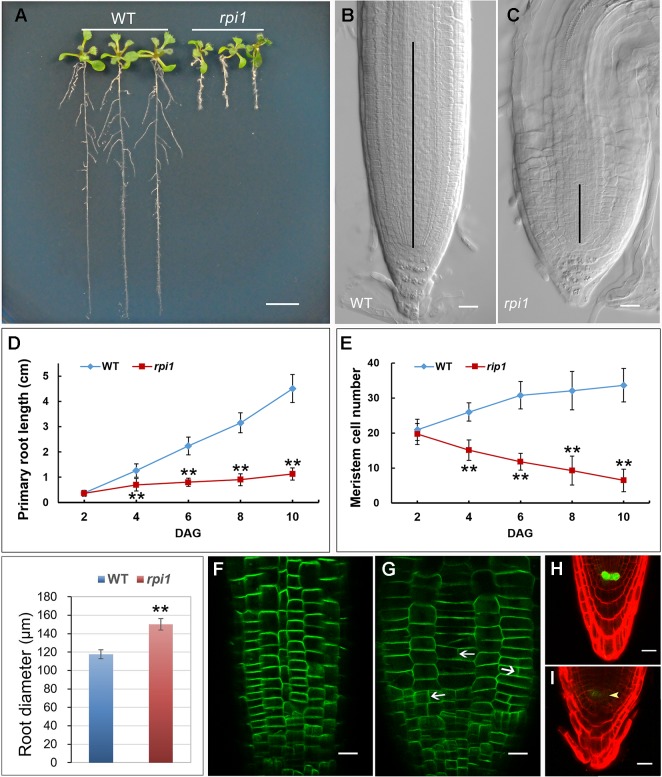
Figure 1.
Phenotypes of dpr3 mutant roots. (A) Phenotype of the wild type (WT, left) and dpr3 (right) seedlings at 10 days after germination (DAG). (B, C) Root tips of the wild type (b) and dpr3 (c) at 10 DAG. The black vertical lines indicate the root meristem region. (D) Primary root length of wild type and dpr3 seedlings from 2 to 10 DAG. Data shown are average and SD (n = 30). Asterisks indicate Student’s t-test significant difference (**P < 0.01). (E) Root meristem cell number of the wild type and dpr3 on 2 to 10 DAG. The root meristem cell number is designated as the number of cortex cells in the cortex file extending from the quiescent center (QC) to the transition zone. Data shown are average and SD (n = 30). Asterisks indicate Student’s t-test significant difference (**P < 0.01). (F) Diameters of primary root meristem. The diameters were measured where the transition zone appeared. Data shown are average and SD (n = 30). Asterisks indicate Student’s t-test significant difference (**P < 0.01). (G, H) The expression of PIN2pro:PIN2-GFP in wild type (g) and dpr3 (h) root tips at 6 DAG. White arrowheads indicate the abnormal cell plates. (I, J) The expression of WOX5pro:GFP in roots of 4-day-old wild type (I) and dpr3 mutant seedlings (J). Bars = 5 mm in (A); 20 μm in (B,C,G–J).

