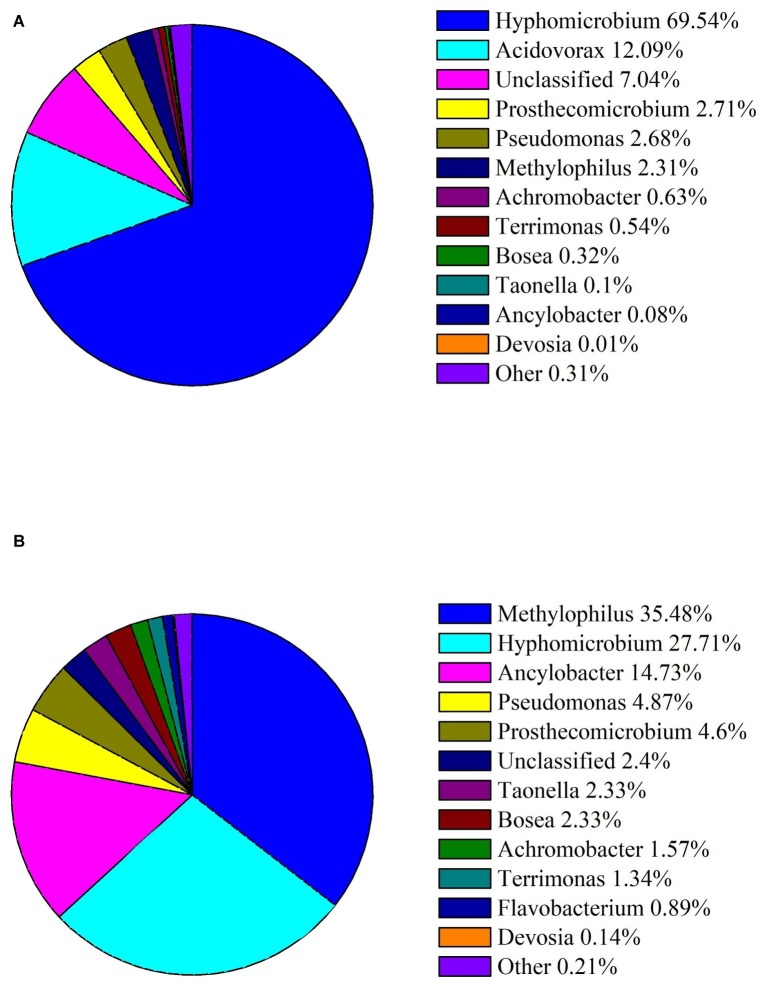
Figure 2.
Abundances of bacterial genera in the enriched culture C20. (A) Relative abundance of bacterial genera in C20 in MM with 10 μg ml−1 DON. (B) Relative abundance of bacterial genera in C20 in MM with 100 μg ml−1 DON. The different colors and areas represent different bacterial genera and their relative abundance present in C20.

