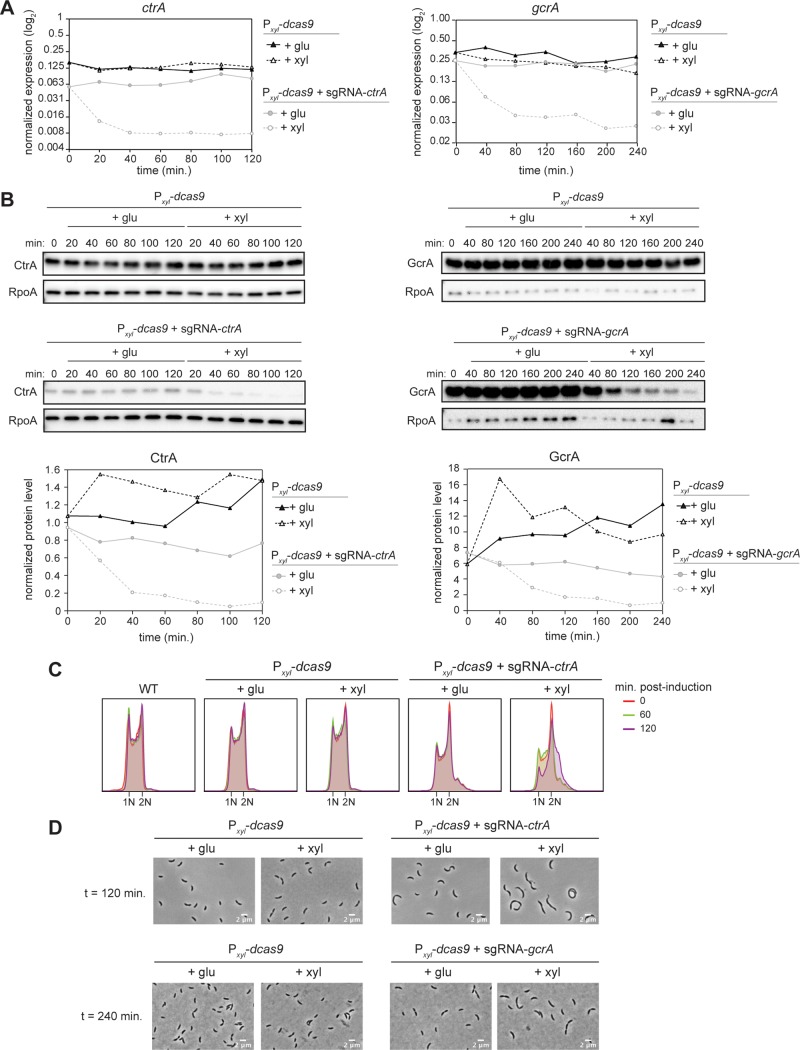
FIG 2.
Downregulation of ctrA and gcrA expression in asynchronous populations of cells using the Sth3 CRISPRi system. (A) ctrA (left) and gcrA (right) mRNA levels measured by qRT-PCR and normalized to rpoA levels. (B) CtrA (left) and GcrA (right) protein levels with and without induction of the CRISPRi system. Graphs show quantifications of CtrA or GcrA protein band intensity normalized to RpoA protein band intensity. (C) Flow cytometry profiles showing the DNA content of a mixed population of cells at different time points after induction or not of the ctrA-targeting CRISPRi system. (D) Phase-contrast images of cells 120 (top) or 240 (bottom) min after induction or not of dcas9 alone or in combination with the ctrA- or gcrA-sgRNA, as indicated. Bar, 2 μm.

