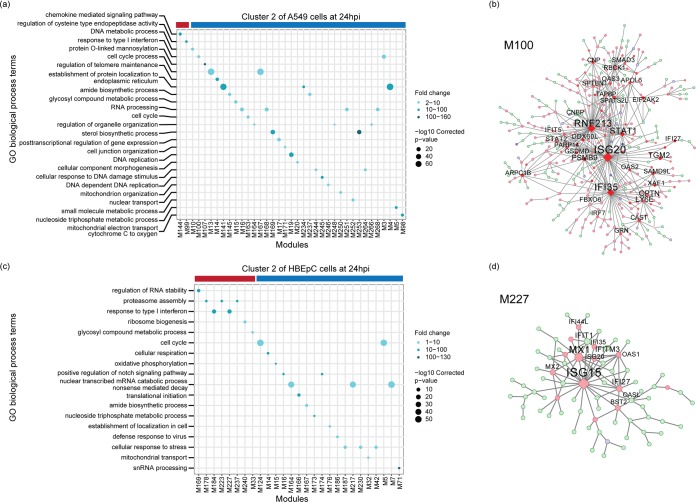
FIG 5.
Functional MEGENA modules in clusters of A549 cells and HBEpC at 24 hpi. The left panels show enriched biological process GO terms in the modules correlated with the relative abundances of virus transcripts in cluster 2 of A549 cells (a) and cluster 2 of HBEpC (c) at 24 hpi. Each GO term is denoted by a bubble. The color intensity of each bubble indicates the fold enrichment of the corresponding GO term, and the size corresponds to the log10-transformed corrected P value for a given GO term. Red and blue color bars above the bubble charts denote positive or negative correlation of viral transcription with corresponding modules, respectively. The right panels show the MEGENA network of modules enriched with the innate immune response, including module M100 in cluster 2 of A549 cells (b) and module M227 in cluster 2 of HBEpC (d). Red and blue nodes represent significantly up- or downregulated genes compared to their expression in other cells in the population, while light-green nodes denote genes that are not significantly differentially expressed. Diamond nodes indicate key regulators. The size of the nodes indicates node strength after multiscale hub analysis within the MEGENA pipeline. Modules that have a significant correlation with the relative abundance of virus transcripts and enriched GO biological process terms are shown in the GO term bubble charts (a and c). Module member information for all viral-transcription-correlated modules can be found on GitHub (https://github.com/GhedinLab/Single-Cell-IAV-infection-in-monolayer/tree/master/AdditionalFiles/MEGENA_Tables).

