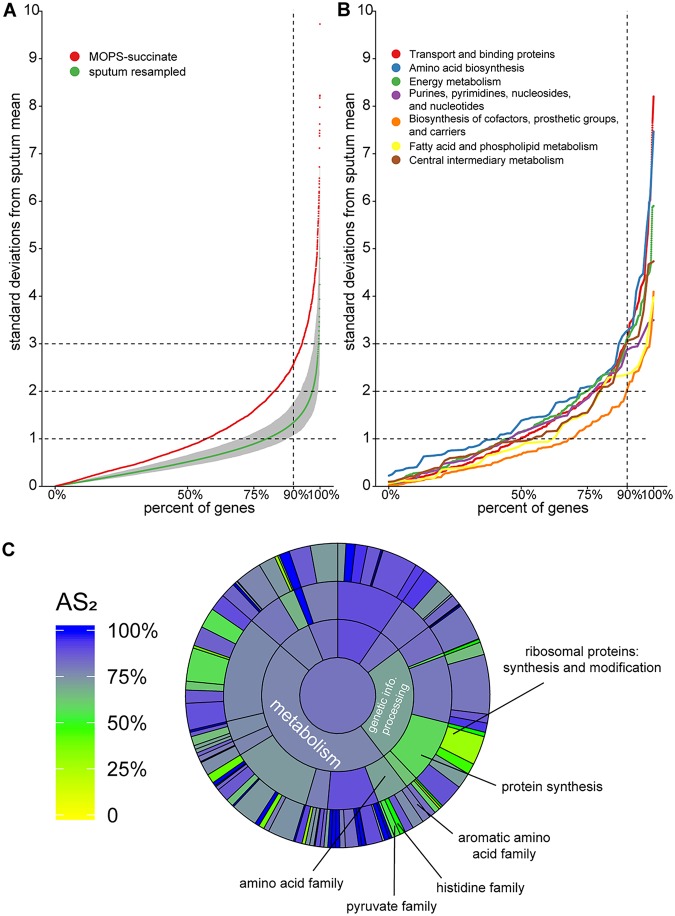
FIG 2.
Genome-wide accuracy metric for strain PAO1 grown planktonically in MOPS-succinate. (A) Percentages of PAO1 genes (x axis) within different numbers of standard deviations of the mean expression in human CF sputum (y axis). For each gene, the mean and standard deviation of normalized read counts among the sputum samples were calculated. The mean expression for each gene in MOPS-succinate was then determined, and a z-score (the number of standard deviations each gene is from the mean expression in CF sputum) was calculated. For reference, we performed the same procedure on 100 randomly resampled pairs of human CF sputum samples to provide a robust assessment of the variance in these samples (sputum resampled). The mean and 95% confidence interval for each of these resampled values for each gene are shown. Any genes with values over 10 standard deviations from the sputum mean are not shown. (B) An accuracy metric was calculated for PAO1 grown in MOPS-succinate for all TIGRFAM “metabolism” meta roles. (C) AS2 for each TIGRFAM meta role, main role, and sub role category for PAO1 grown in MOPS-succinate. The color in the middle represents the AS2 for all PAO1 genes (those with or without TIGRFAM designations). The next level out from the middle of the circle contains “meta roles,” the next contains “main roles,” and the outermost layer contains “sub roles.” The area of each category is proportional to the number of genes in that category.

