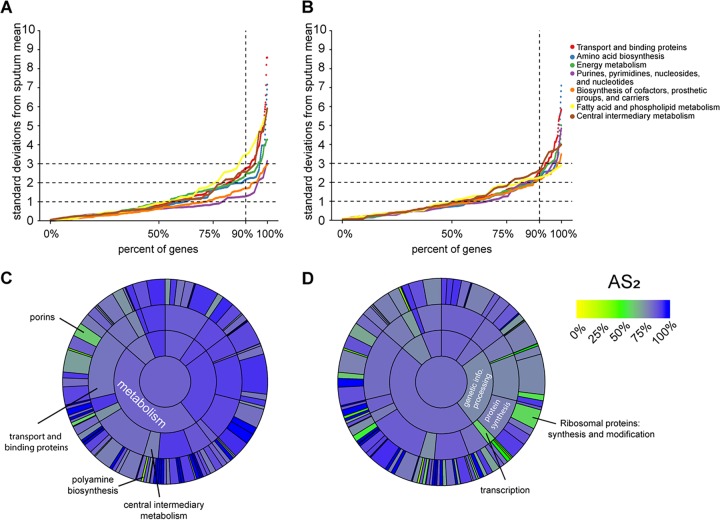
FIG 4.
Accuracy metric for TIGRFAM subcategories for P. aeruginosa PAO1 in SCFM2 and the CF airway epithelial cell infection model. (A and B) Percentages of P. aeruginosa PAO1 genes within each TIGRFAM metabolism “sub role” whose mean expression in SCFM2 (A) and CF airway epithelial cell infection model (B) transcriptomes fall within different numbers of standard deviations of the mean expression in sputum samples (absolute value of z-score, calculated as described in Fig. 2A). (C and D) AS2 for each TIGRFAM meta role, main role, and sub role category for SCFM2 (C) and the CF airway epithelial cell infection model (D). The color in the middle represents the AS2 for all PAO1 genes (those with or without TIGRFAM designations). The next level out from the middle of the circle contains “meta roles,” the next contains “main roles,” and the outermost layer contains “sub roles.” The area of each category is proportional to the number of genes in that category.

