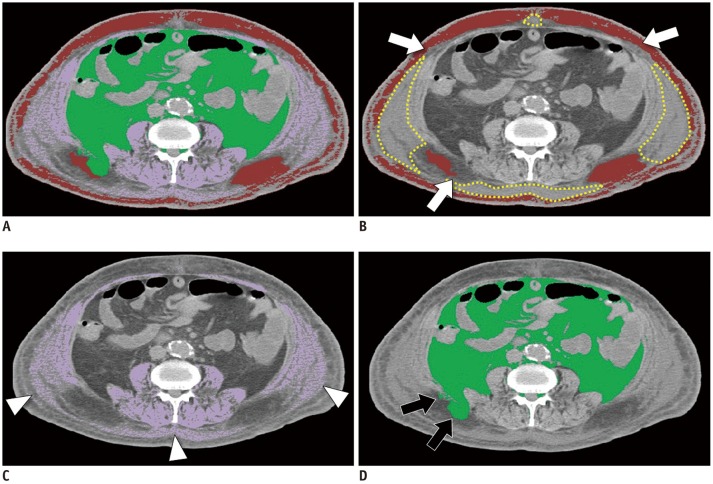
Fig. 6. Example of segmentation error.
A. Fusion image of all segmented areas. B. Segmentation map of subcutaneous fat (coded in red). There are areas with higher density compared with fat in subcutaneous area, which represent edema (dotted yellow line). Parts of subcutaneous fat abutting edema are not included in segmented subcutaneous fat (arrows). C. Segmentation map of skeletal muscle (coded in purple). Note subcutaneous edema segmented as muscle (arrowheads). D. Segmentation map of visceral fat. Some subcutaneous fat is erroneously segmented as visceral fat (arrows). Dice similarity coefficients are 0.78, 0.92, and 0.96 for subcutaneous fat, skeletal muscle, and visceral fat, respectively.

