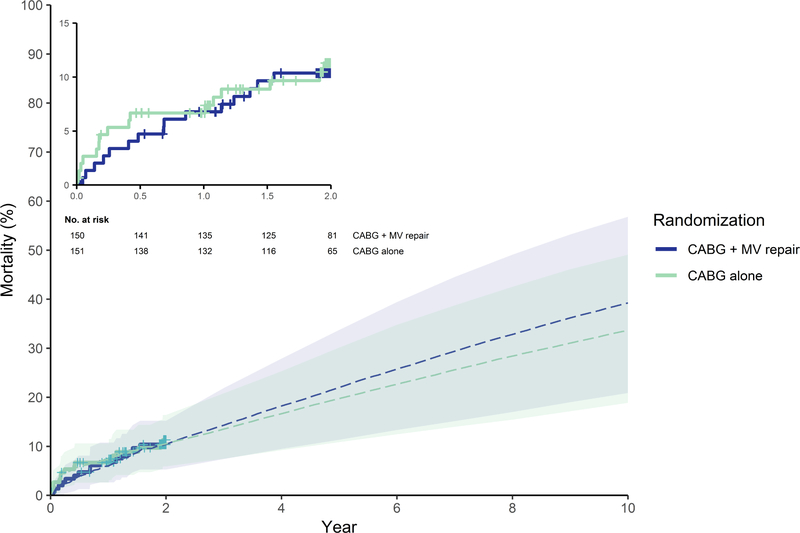
Figure 2. Observed and simulated all-cause mortality estimates by study arm.
Shown are all-cause mortality (%) estimates based on Kaplan-Meier curves of N=150 for CABG plus mitral-valve repair and N=151 for CABG alone with censoring at 2-year (solid lines) and simulated mortality estimates used for extrapolation in the base case long-term cost-effectiveness analysis (dashed lines). Shown are numbers at risk with accounting for censored observations for the first 2 years of follow-up, beyond the 2 years simulated mortality applies. Abbreviations: MV, mitral-valve.

