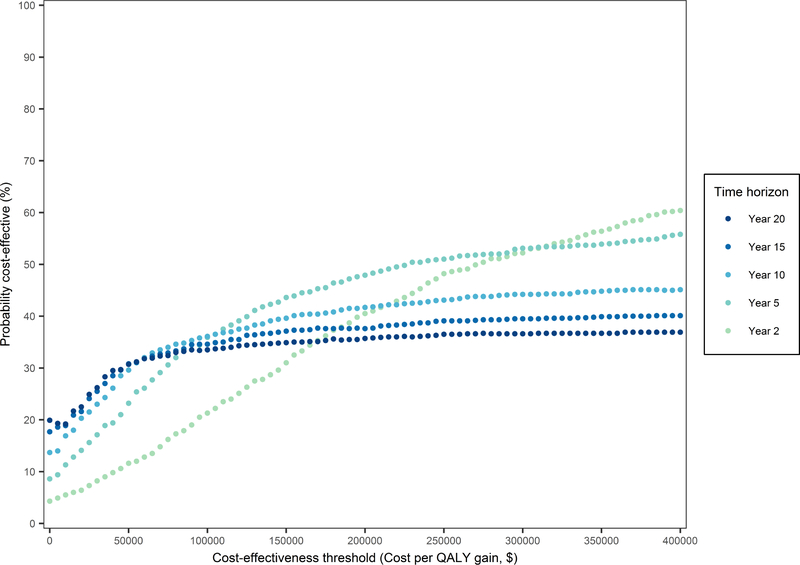
Figure 4. Cost-effectiveness acceptability curves for CABG plus mitral-valve repair vs CABG alone according to time horizon.
These curves indicate the probability (%) of CABG plus mitral-valve repair being cost-effective as compared with CABG alone using different time horizons. Each curve equals the obtained percentage of bootstrap iterations (1,000 in total) in which the repeated cost-effectiveness analysis showed that CABG plus mitral-valve repair was dominant (less costly and QALYs ≥ CABG alone) or had a favourable incremental cost-effectiveness ratio (ICER) with a cost($) per QALY gained value lower than the selected cost-effectiveness threshold on the X-axis. The probability of CABG alone being cost-effective equals 100% minus the depicted probability of CABG plus mitral-valve repair being cost-effective.

