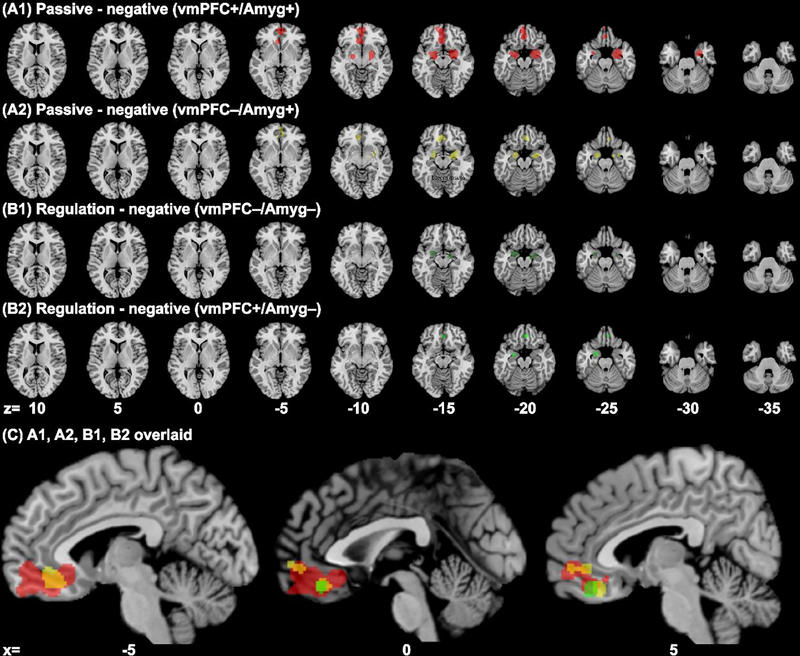
Figure 4.
Results of subgroup ALE analysis of experiments involving negative emotions and showing different patterns of vmPFC and amygdala activities (cluster level p < 0.05, FWE corrected, with a cluster-forming threshold of voxel p < 0.001): (A1) [vmPFC+/Amyg+ (passive)] (red), (A2) [vmPFC−/Amyg+ (passive)] (yellow); (B1) [vmPFC−/Amyg− (regulation)] (dark green), (B2) [vmPFC+/Amyg− (regulation)] (green). Panel (C) shows A1, A2, B1 and B2 clusters overlaid on parasagittal sections. Voxels that overlapped between A1 and A2 appeared orange.

