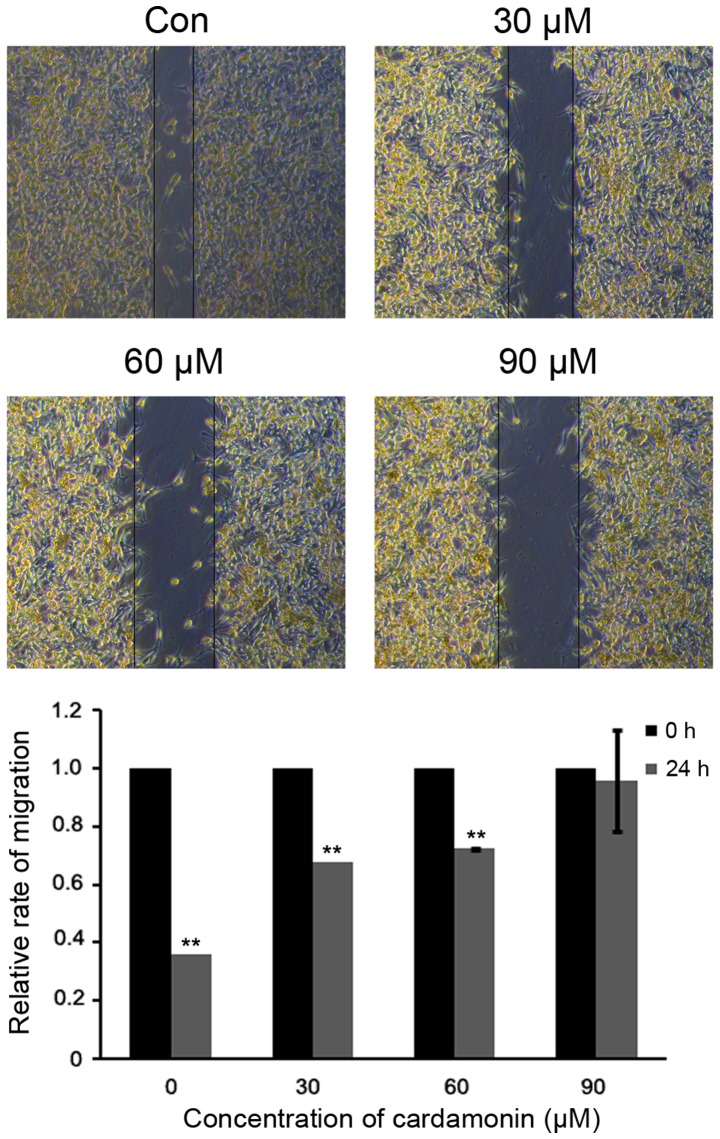
Figure 6.
M14 cells are treated with different concentrations of cardamonin (0, 30, 60 and 90 µM) for 24 h, and migration is inhibited. The levels of different groups were quantified and are shown in a histogram. Significance levels between distinct groups were measured and analyzed using one-way analysis of variance. **P≤0.01 vs. control.

