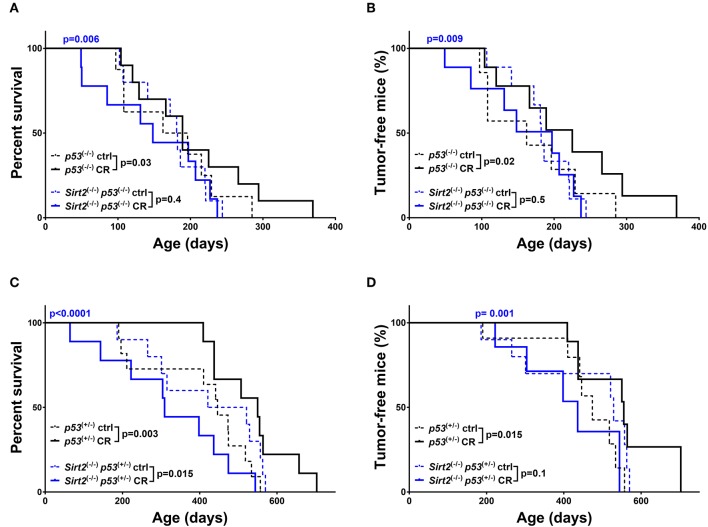
Figure 2.
Sirt2 deficiency abolished CR-mediated increased survival and tumor protection in mice. Kaplan-Meier curves show overall survival (A,C) and tumor free survival (B,D). Sirt2−/−; p53−/− (blue lines) and p53−/− (black lines) mice (A,B), Sirt2−/−; p53+/− (blue lines) and p53+/− (black lines) (C,D) were included in the analysis. Mice were either calorie restricted (CR) or fed ad libitum control diet. Solid lines represent mice in the CR groups, whereas control diet groups are represented in dotted lines. The blue p-values on the top of each curve represent the statistical difference in survival and tumor incidence between calorie restricted Sirt2−/− mice, and calorie restricted Sirt2+/+ mice with similar p53 genotypes. All p-values are calculated using the log rank test.

