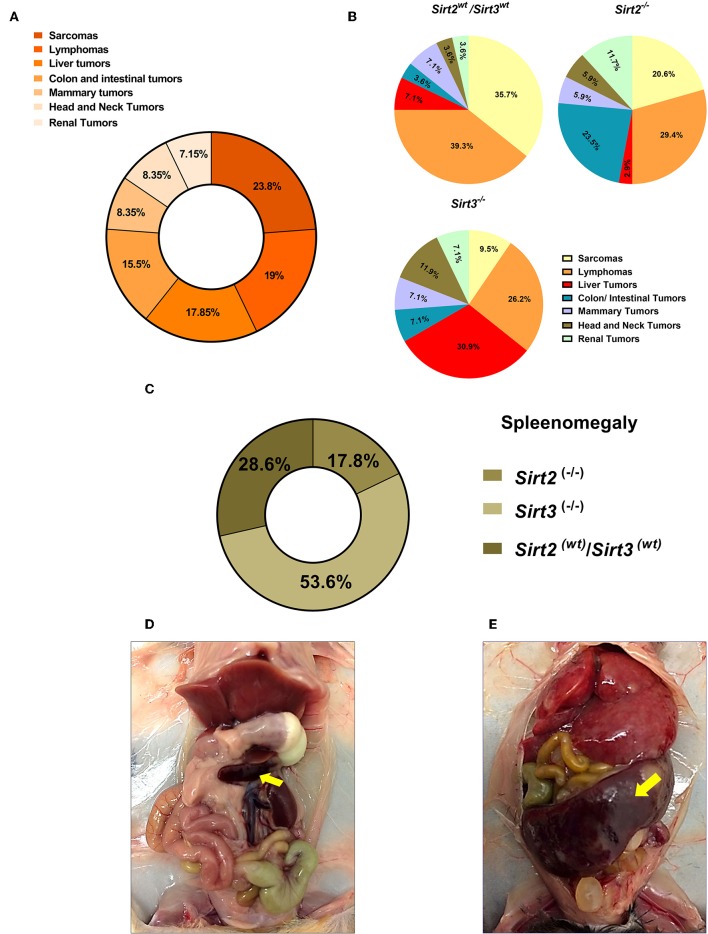
Figure 6.
Spectrum of tumors developed in the Sirt2 and Sirt3-deficient mice. (A) Percentages of different tumor types refer to proportion of all tumors reported, with sarcoma and lymphoma being the most prominent tumors reported. (B) Relative frequencies of the different types of tumors detected in Sirt2wt/Sirt3wt, Sirt2−/−, and Sirt3−/− mice, regardless of the dietary group, are displayed by pie charts. (C) 26 mice with splenomegaly were found in this study. Majority of cases (~54%) were reported in Sirt3 knockout mice. (D,E) Representative pictures of a mouse with normal spleen size (D) and a mouse with splenomegaly (E) are shown.

