FIGURE 1:
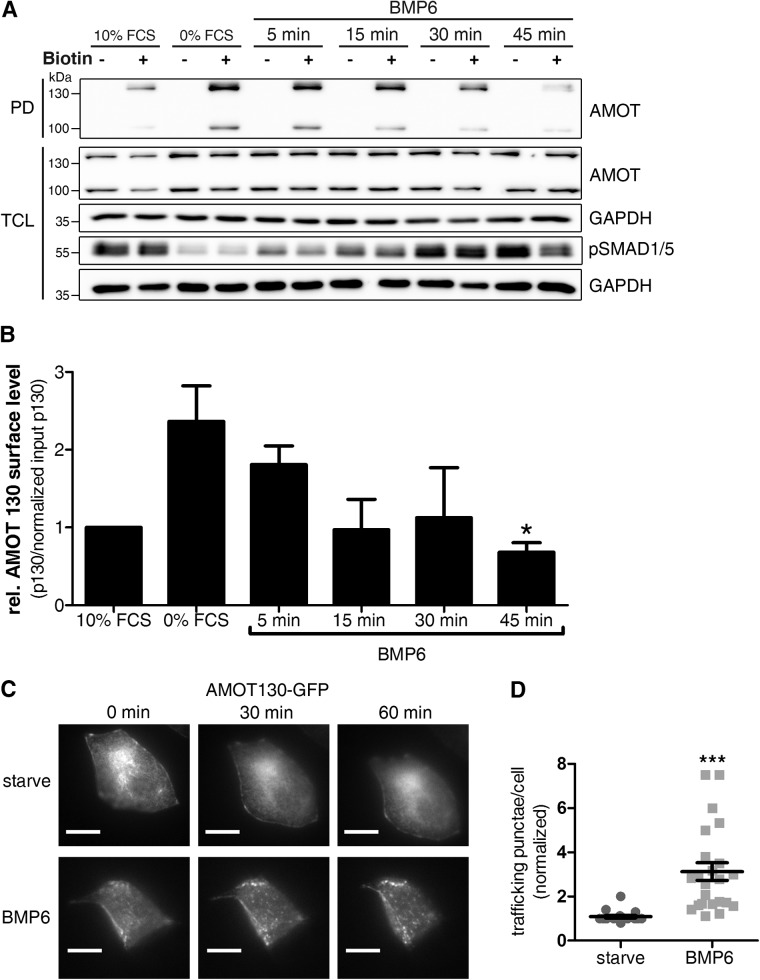
Trafficking of AMOT130 is increased after BMP6 stimulation. (A) HEK293T cells were stimulated with 10 nM BMP6 for the indicated time points, subjected to surface biotinylation, and lysed, and biotinylated proteins were precipitated with streptavidin beads. Eluted proteins were immunoblotted using the indicated antibodies. Pull down (PD) with streptavidin beads only represents proteins expressing an extracellular motif. TCL is the protein input before streptavidin pull down. The blot is representative of three independent experiments. (B) Densitometric quantification of AMOT130 surface levels as blotted in A. Band intensity of biotinylated AMOT130 was normalized to AMOT TCL levels (relative to GAPDH). Data are presented as mean ± SEM relative to 10% FCS of three independent experiments; *p < 0.05, one-way ANOVA with Bonferroni post-hoc test compared with 0% FCS control. (C) MCF7 cells, expressing GFP-tagged AMOT130, were analyzed microscopically during BMP6 stimulation. Cells were incubated in a live cell incubation chamber and stimulated for 1 h. Images of the GFP signal were taken every 30 s. Scale bar represents 10 µm. Representative cells are also depicted as movie files. (D) Quantification of GFP-positive punctae after 1 h of BMP6 stimulation for at least 20 cells per condition of three independent experiments. Data are presented as mean fold induction 60 min/0 min ± SEM signals per cell; ***p < 0.001, unpaired Student’s t test.

