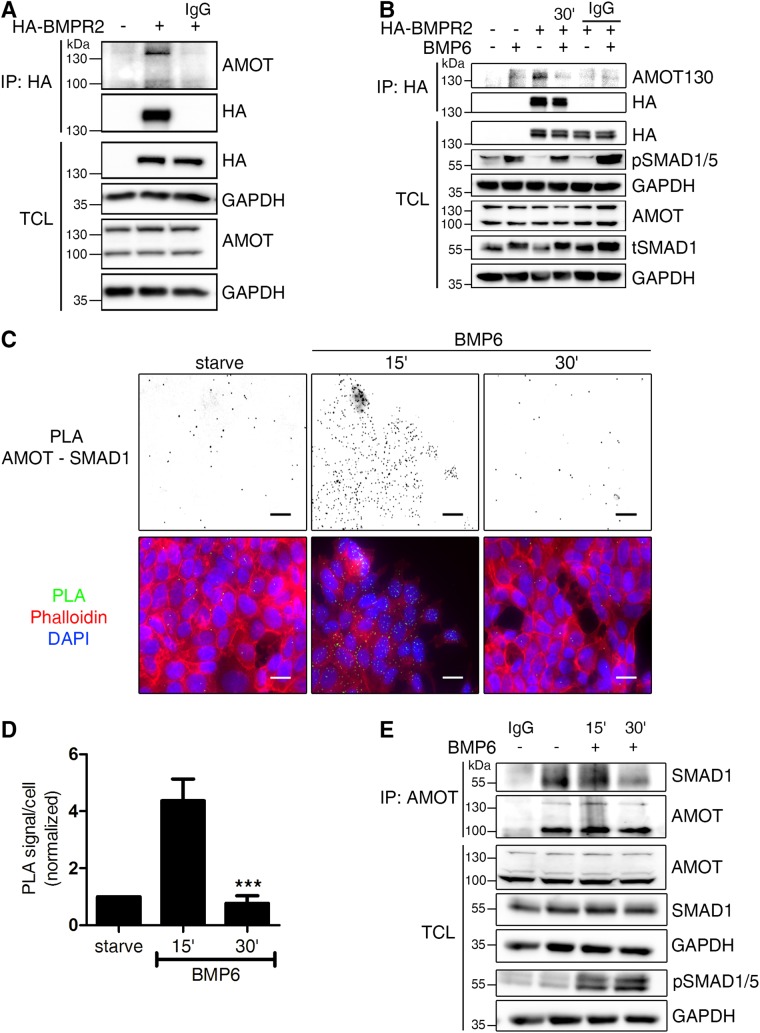
FIGURE 2:
AMOT130 but not AMOT80 dynamically associates with the BMPR2 and SMAD1. (A, B) Transfected HEK293T cells were subjected to immunoprecipitation using α-HA tag antibody. Before, cells were left in full medium (A) or starved and stimulated for 30 min with 10 nM BMP6 (B). Immunoprecipitates (IP) and TCL were analyzed by Western blotting using the indicated antibodies. Incubation with mouse immunoglobulin G (IgG) served as control. (C) In situ PLA of AMOT and SMAD1. MCF7 cells were subjected to in situ PLA (green signal) to visualize the endogenous association of AMOT and SMAD1 after the respective indicated treatments. Nuclei were stained with DAPI (blue) and F-actin with Phalloidin594 (red). PLA signal images were inverted to visualize the signal. Scale bar represents 20 µm. Relevant controls are depicted in Supplemental Figure S2. (D) Quantification of AMOT/SMAD1 heteromers shown in C. The bar chart represents mean ± SD from three independent experiments; ***p < 0.001, one-way ANOVA with Bonferroni post-hoc test compared with 15′ condition. (E) Endogenous interaction of AMOT with SMAD1. MCF7 cells were starved and stimulated for the indicated time points with 10 nM BMP6 before lysis and immunoprecipitation using α-AMOT (BL) antibody. Precipitates and TCL were analyzed by Western blotting using the indicated antibodies. Rabbit IgG served as control.

