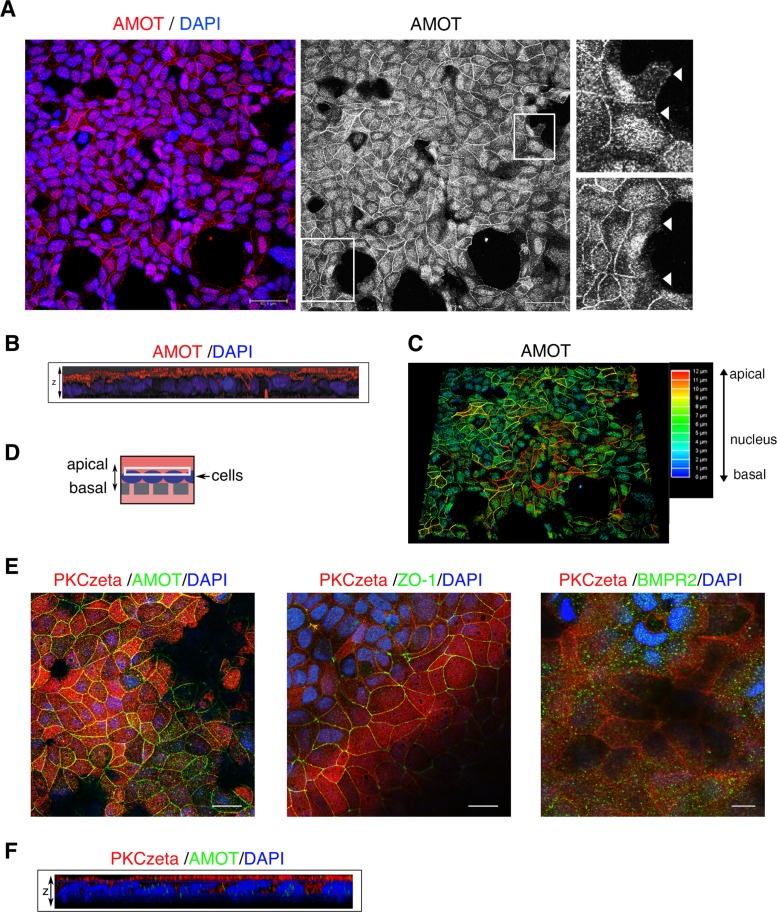
FIGURE 5:
AMOT predominantly localizes at apical cell–cell junctions and the nucleus in polarized MCF7 cells. (A) MCF7 cells were subjected to immunofluorescence staining using α-AMOT (BL) antibody (red). Nuclei were stained with DAPI (blue). Scale bar represents 20 µm. Images were taken at a confocal microscope by applying a z-stack and depicting maximal projection. Right panel shows only AMOT. Zoom-in images depict AMOT staining on sites without cell–cell contacts, marked by white arrows. (B) 3D analysis of the picture shown in A. Z-stack merge is depicted from side view. (C) Depth analysis of the AMOT signal. (E) MCF7 cells were seeded in transwells and subjected to immunofluorescence staining using the indicated antibodies. Z-stacks were taken at a confocal microscope and representative images depict the apical membrane as indicated by the white rectangle in D. Cells were confluent; dark spots represent nonfocused areas, because transwell membranes were not flat. Scale bar represents 20 µm. (F) Z-stack merge is depicted from side view for PKCzeta/AMOT. Supplemental videos of z-stacks: Supplemental Video S1 depicts AMOT (green) and PKCzeta (red) from basal to apical; Supplemental Video S2 depicts ZO-1 (green) and PKCzeta (red) from basal to apical; Supplemental Video S3 depicts BMPR2 (green) and PKCzeta (red) from apical to basal.

