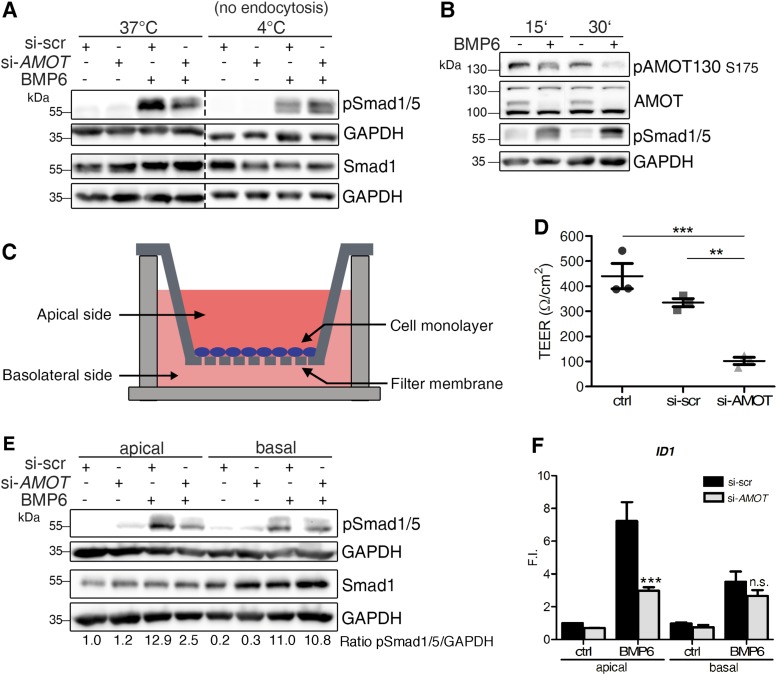
FIGURE 6:
AMOT drives apical SMAD signaling via endocytosis. (A) MCF7 cells were depleted of AMOT and stimulated with BMP6 at 37°C or at 4°C. Lysates were analyzed by Western blotting using the indicated antibodies. (B) MCF7 cells were starved and stimulated with BMP6 for the indicated time points. Lysates were analyzed by Western blotting using the indicated antibodies. (C) Experimental setup for apical–basal-specific BMP stimulation of MCF7 cells in specific transwell inserts. (D) MCF7 cells transfected with siRNA targeting AMOT (si-AMOT) or scr control (si-scr) were seeded into transwells and their TEER was measured. Data are presented as mean ± SEM of three independent experiments; **p < 0.01, ***p < 0.001, one-way ANOVA with Bonferroni post-hoc test. (E) MCF7 cells transfected with siRNA targeting AMOT (si-AMOT) or scr control (si-scr) were seeded until confluency in transwells depicted in C and stimulated specifically from the apical or basal side. Lysates were analyzed by Western blotting with the indicated antibodies. All blots are representive for each four independent experiments. (F) Target gene expression measured by qRT-PCR after 1 h of BMP6 stimulation in transwell experiment. After 1 h of stimulation, cells were lysed and RNA was extracted, reverse transcribed, and used for gene expression analysis of ID1 mRNA. Data are presented as mean fold induction (F.I.) ± SEM of four independent experiments; ***p < 0.001, two-way ANOVA with Bonferroni post-hoc test compared with si-scr stimulated apically or basally with BMP6.

