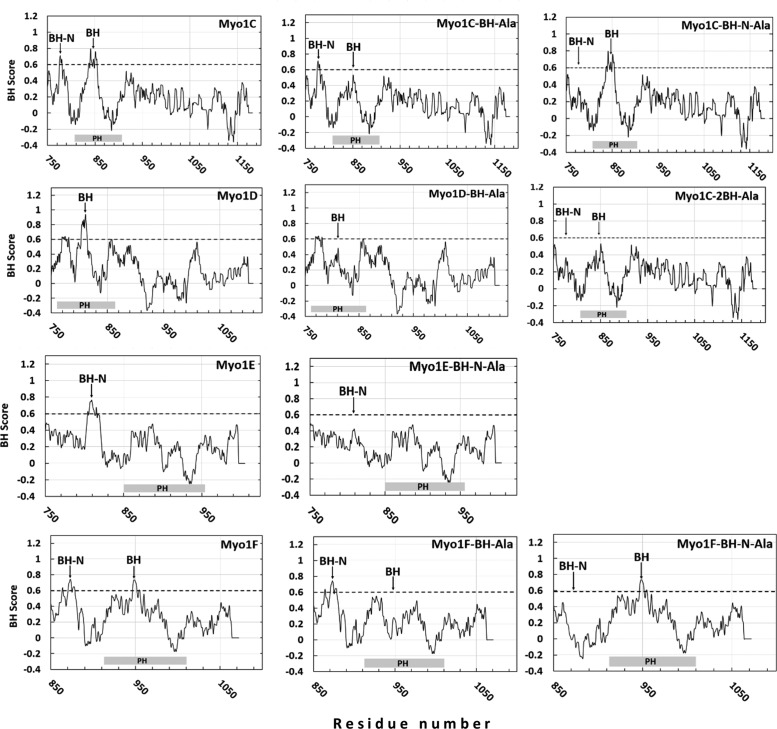
FIGURE 8:
BH plots of the tail regions of Dictyostelium myosin 1s and their mutants. Myosins are shown in the left column and mutants in which the BH sites were mutated are in the center and the right columns. Positions of BH peaks are marked with arrows and positions of PH domains are marked at the bottom of each panel as gray rectangles.

