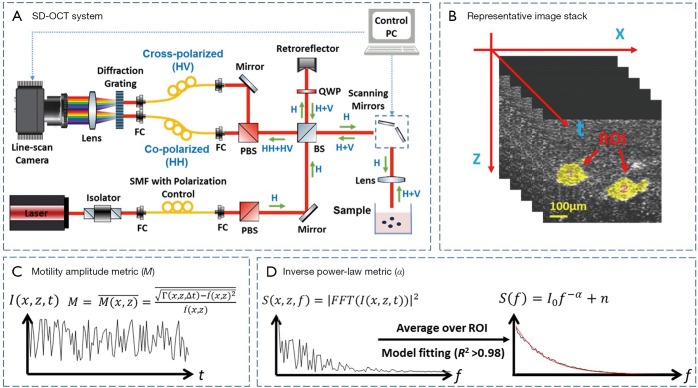
Figure 1.
Overview of OCT-SFS hardware, data collection, and analysis pipeline. (A) Spectral domain OCT system; (B) a representative time-stack of 100 successive B-mode images for analysis; (C) metric for motility amplitude; (D) power spectral analysis of OCT fluctuations. FC, fiber coupler; BS, beam splitter; PBS, polarizing beam splitter; QWP, quarter wave plate; ROI, region of interest; OCT-SFS, optical coherence tomography speckle fluctuation spectroscopy.

