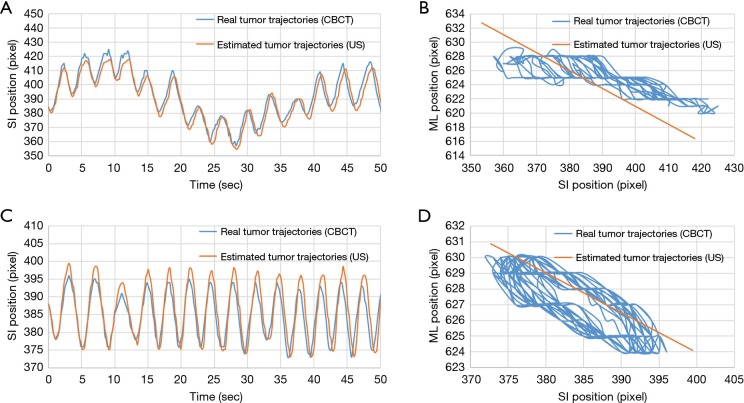
Figure 9.
Comparison of real tumor phantom trajectories (obtained using CBCT) and estimated tumor phantom trajectories (obtained using ultrasound). (A,B) Motion trajectories of the tumor phantom in the SI direction and all of the recorded motion trajectories of all tumors in the coronal plane, respectively, under respiratory pattern B and tumor motion-conversion model II. (C,D) Motion trajectories of the tumor phantom in the SI direction and all of the recorded motion trajectories of all tumors in the coronal plane, respectively, under respiratory pattern D and tumor motion-conversion model II. Each pixel corresponds to 0.3 mm. SI, superior-inferior; ML, medial-lateral; CBCT, cone-beam computed tomography.

