-
A, B
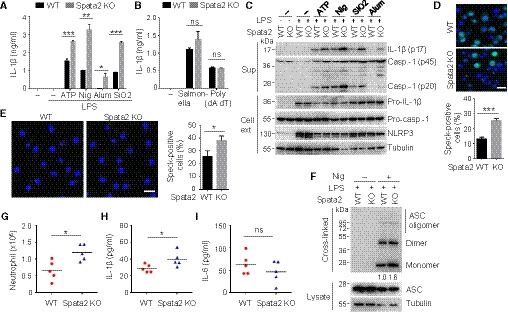
ELISA of IL‐1β secretion by WT or Spata2‐KO BMDMs that were either untreated (−) or LPS‐primed and then treated with the indicated NLRP3 inducers (A) or stimulated with the NLRC4 inducer (Salmonella infection) or AIM2 inducer (Poly(dA:dT) transfection) (B). Bars and error bars represent the mean ± SD of triplicate experiments. *P < 0.05; **P < 0.01; ***P < 0.001. Statistical analysis was performed using unpaired two‐tailed Student's t‐test.
-
C
Immunoblot analysis of the mature IL‐1β p17 and the active caspase‐1 p20 in cell supernatants (Sup) and the indicated proteins in the cell extracts (Cell ext) of WT or Spata2‐KO BMDMs stimulated as in (A).
-
D
WT and Spata2 CRISPR knockout (KO) iBMDMs stably expressing GFP‐ASC were primed with LPS and stimulated with Nigericin for 1 h. GFP‐ASC specks were imaged by confocal microscope, and percentage of ASC speck‐positive cells was quantified. Scale bar, 10 μm. Bars and error bars represent the mean ± SD of triplicate experiments. ****P < 0.0001. Statistical analysis was performed using unpaired two‐tailed Student's t‐test.
-
E
BMDMs from Spata2
+/+ (WT) and Spata2
−/− (KO) mice were pretreated with caspase‐1 inhibitor, Z‐YVAD‐FMK, for 30 min, primed with LPS, and then stimulated with Nigericin for 1 h. ASC specks were assessed by immunofluorescence with antibody against ASC and imaged by confocal microscope, and percentage of ASC speck‐positive cells was quantified. Scale bar, 10 μm. Bars and error bars represent the mean ± SD of triplicate experiments. *P < 0.05. Statistical analysis was performed using unpaired two‐tailed Student's t‐test.
-
F
Immunoblot analysis of ASC in soluble cell lysate and DSS cross‐linked insoluble fraction of WT or Spata2‐KO BMDMs primed with LPS and stimulated without or with nigericin (Nig) for 1 h. Relative levels of ASC in cross‐linked samples from LPS+ Nig treated cells were quantitated and shown below.
-
G‐I
Spata2
+/+ (WT) and Spata2
−/− (KO) mice were injected intraperitoneally (i.p.) with alum (20 mg/kg bodyweight) and sacrificed 6 h latter to collect peritoneal lavages. Absolute numbers of neutrophils recruited to the peritoneum were counted by FACS (G); levels of IL‐1β (H) and IL‐6 (I) in the peritoneal fluids were measured by ELISA. Circles and triangles represent individual mice. Horizontal bars indicate mean values. *P < 0.05. Statistical analysis was performed using unpaired two‐tailed Student's t‐test.
Data information: For all Immunoblotting data, molecular weights in kDa are indicated to the left.

