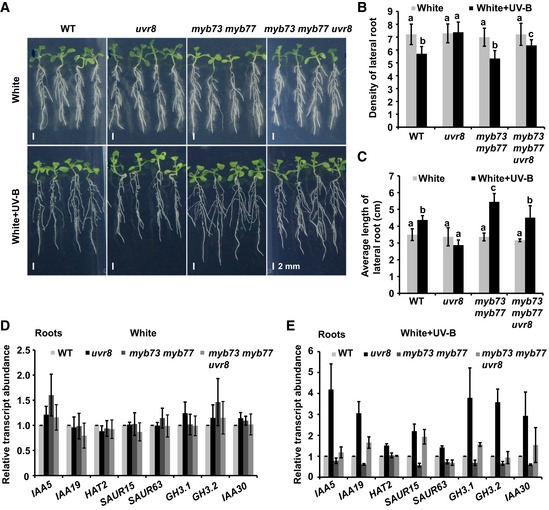
Figure 6. MYB73/MYB77 acts downstream of UVR8 in controlling the auxin response.

-
A–CPhenotypic analysis. Seedlings of the indicated genotypes were grown in LD conditions (16‐h light/8‐h dark) for 5 days, then transplanted to new medium containing 0.4 μM NAA, and kept in continuous white light or white plus UV‐B light (1 W/m2) for 7 days. Images are shown in (A); scale bars = 2 mm. Lateral root density (number of lateral roots/length of primary root) (B) and average length of lateral roots (C) of the indicated genotypes were measured. SDs (n > 8) are indicated. Letters “a” to “c” indicate statistically significant differences for the indicated values, as determined by a one‐way analysis of variance (ANOVA), followed by Tukey's least significant difference (LSD) test (P < 0.05). There was statistically significant difference between values marked with different letters (for example “a” and “b”), while there was no statistically significant difference between values marked with the same letters (for example “a” and “a”).
-
D, EQuantitative RT–PCR analysis of auxin signaling gene expression in roots of wild type (Col‐0), uvr8, myb73 myb77, and myb73 myb77 uvr8. (D) Results under white light and (E) under white plus UV‐B light. Seedlings grown in continuous white light for 12 days were kept in white light or transferred to white light plus UV‐B for 1 day with the addition of 0.4 μM NAA, and roots were collected to analyze auxin signaling gene expression. Error bars represent SD of three biological replicates.
