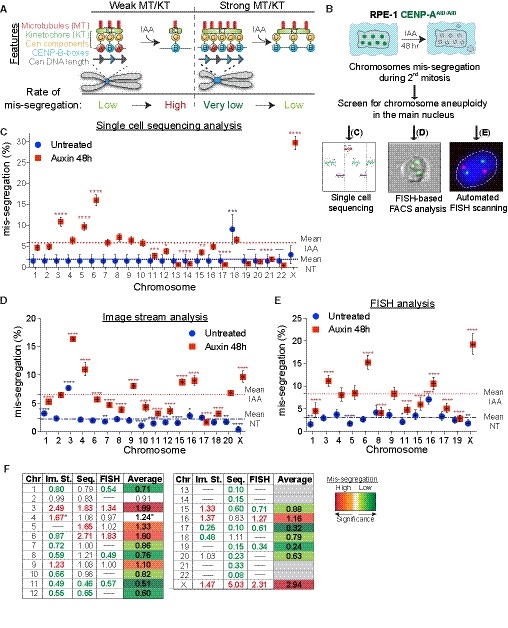
Figure 1. Chromosome‐specific aneuploidy arises following CENP‐A removal in RPE‐1 cells.

-
AModel of centromere strength via CENP‐C recruitment supported by DNA sequence and CENP‐B. KT = kinetochore, MT = microtubules. IAA = auxin. Cen = centromere. Blue arrows represent CENP‐B boxes. Upon IAA addition, AID‐tagged CENP‐A is degraded.
-
BSchematic of the experiments shown in (C–E).
-
C–ELogistic statistical model based on the (C) single‐cell sequencing, (D) ImageStream (E) analysis or automated FISH of RPE‐1 cells in untreated condition (blue circles) or treated with auxin for 48 h (red squares). Error bars represent the SEM based on the number of cells analyzed (see the statistical method section for details and Datasets EV1 and EV2). Dashed lines indicate the means of aneuploidy rates in untreated (blue line) or auxin‐treated (red line) condition. Red asterisks (IAA) and blue (Untreated) indicate significance over the respective mean using a binomial test. *P < 0.05; **P < 0.01; ***P < 0.001; ****P < 0.0001.
-
FTable summarizing whole‐chromosome aneuploidy (fold over the mean) using the indicated methods to measure chromosome mis‐segregation rate. Bold numbers represent a statistically significant difference from the mean for each method. Orange to dark red gradient highlights chromosomes that mis‐segregate (with at least one method) at a significantly higher rate compared to the mean level (weak chromosomes). Light green to dark green gradient highlights chromosomes that mis‐segregate (with at least one method) at a significantly lower rate compared to the mean (stronger chromosomes). Data obtained with only one method were excluded. *centromere 4 probe with image stream was reported to lead to non‐specific signal (Worrall et al, 2018). Im. St. = image stream; Seq = single‐cell sequencing.
