-
A
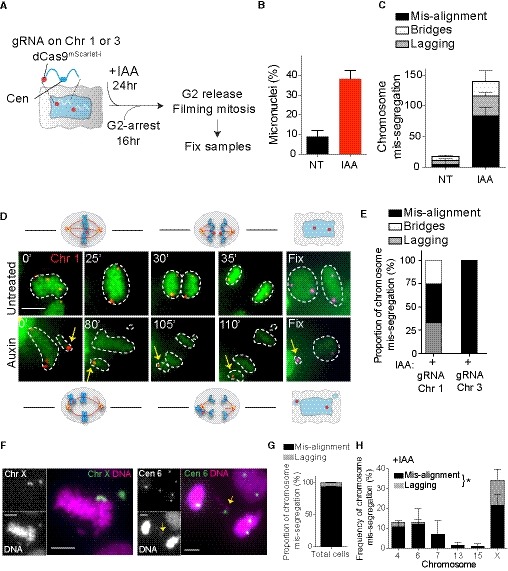
Schematic of the experimental procedure used in (B–E). Closer view of the labeled chromosome shows the targeted locus for the dCas9.
-
B, C
(B) Micronuclei frequency formation by live cell imaging in untreated (NT) and auxin‐treated (IAA) condition. (C) Bar graph represents the type of chromosome mis‐segregation (independently of the dCas9 signal) observed in the indicated conditions, with (IAA) or without (NT) auxin, in the cell lines expressing dCas9 mScarlet‐I and sgRNA targeting chromosome 1 or 3. Error bars represent the SEM of four independent experiments in which cells labeled for chromosomes 1 and 3 were analyzed together (n = 45–149 cells).
-
D
Representative live cell imaging of RPE‐1 cells dCas9 mScarlet‐I with sgRNA targeting chromosome 1 (red dots) starting from metaphase and showing example of correct (untreated) or mis‐aligned chromosome (auxin) leading to the formation of a micronucleus. Yellow arrows mark mis‐aligned‐ and micronucleus‐containing chromosome 1. Cells were imaged every 5 min. The numbers indicate the time point at which the presented images were taken. Cells were fixed at the end of the movie to detect Cas9 with an antibody. Scale bar represents 10 μm.
-
E
Bar graph representing the proportion of chromosome mis‐segregation observed in both cell lines after auxin addition. Only movies in which the dCas9 mScarlet‐I dots were clearly visible during the whole division were taken into consideration for the analysis (N = 6–10 cells).
-
F
Representative images of mitotic errors leading to aneuploidy in fixed cells after CENP‐A depletion (28 h auxin). Chromosomes are stained using whole (X) or centromeric (6) FISH probes. Yellow arrows mark lagging chromosomes. Scale bar represents 5 μm.
-
G, H
Bars represent the (G) proportion of chromosome mis‐segregation and (H) the type of the different chromosome mis‐segregations observed. Error bars represent the SEM of two replicates. n > 66 mis‐segregation events. Paired t‐test lagging chromosomes versus mis‐alignment chromosomes, *P = 0.0275.

