-
A
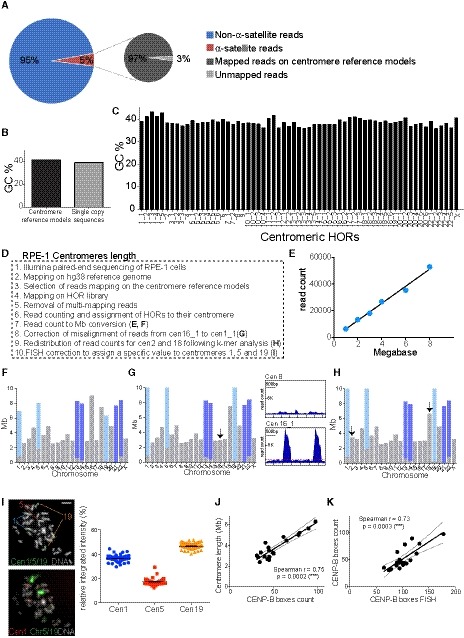
Pie charts representing the fraction of alpha‐satellite‐containing reads of the total read pool (left) and representing the fraction of alpha‐satellite‐containing reads that can be mapped on the centromere reference models by using our method (right). Both charts refer to the whole‐genome DNA sequencing of RPE‐1 cells.
-
B
Barplot showing the average GC percentage of the centromere reference models versus the GC percentage of the single‐copy sequences that were used for centromere length determination with standard curve.
-
C
Barplot reporting the GC content across all HOR array consensus sequences used as reference.
-
D
Stepwise procedure of RPE‐1 centromere length analysis.
-
E
Example of standard curve used to convert whole‐genome sequencing read counts into megabases (Mb), for the determination of centromere length. Each point represents a randomly chosen single‐copy region of the genome.
-
F
Centromere length after conversion to Mb using the standard curve shown in (E). The gray bars correspond to the length of centromere‐specific HOR arrays; the light and dark blue bars represent the length of the HOR array shared by chr1, 5, 19 (“cen1_1”) and chr13, 14, 21, 22 (“cen13_1”, “cen22_1”), respectively.
-
G
(Left) Centromere length correction after reassignment of the reads from cen16_1 (chr16 specific) to cen1_1 (shared among chr1, 5, 19). The arrow marks the chromosome that changed compared to (F). (Right) Representative plots of read coverage along the HOR sequence of “cen 8”, not showing any misalignment, and “cen16_1”, showing misalignment.
-
H
Centromere length correction after redistribution of read counts between centromere 2 and centromere 18 following k‐mer analysis. The arrows mark the chromosomes that changed compared to (G).
-
I
Representative images of the sequential FISH using alpha‐satellite cen1/5/19 FISH probe (which recognizes the cen1_1 D1Z1 HOR) followed by chromosome 1, 5, 19 FISH labeling. The scatter plot represents signal quantification of alpha‐satellite cen1/5/19. Error bars represent the SEM of two independent experiments (n = 47 cells). Scale bar represents 5 μm.
-
J, K
Scatter plot showing a significant positive correlation between the mean of (J) centromere length (n = 4) and CENP‐B boxes count (n = 4) and (K) centromere CENP‐B boxes FISH data (n > 50 cells) and CENP‐B boxes count (r = Spearman rank coefficient). Data from chr 13, 14, 21 and 22 were excluded from the analysis. The lines represent linear regression with 95% confidence interval.

