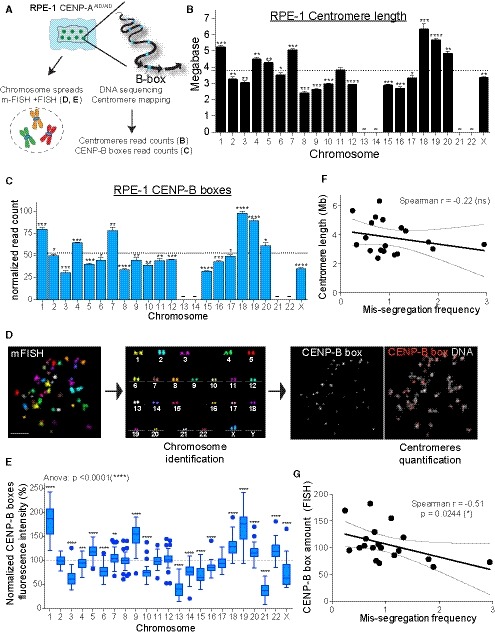
Figure 3. Centromeres of individual chromosomes vary in DNA sequence and CENP‐B boxes abundance.

-
ASchematic of the experiments shown in (B–E).
-
B, CBar plot showing the mean of (B) centromere length (n = 4) and (C) CENP‐B boxes counts (n = 4) as determined by whole‐genome sequencing. Error bars represent the SEM of four independent experiments. Acrocentric chromosomes 13, 14, 21, and 22 were marked by a line as we could not assign the respective reads. Dashed lines indicate the mean. Bars were labeled with asterisks according to the significance of their difference from the mean (t‐test). *P < 0.05; **P < 0.01; ***P < 0.001; ****P < 0.0001. Bars represent the sum of the length or counts of different HOR arrays (see Table EV2). CENP‐B boxes counts are normalized to the average number of mapped reads in each replicate.
-
DSchematic using representative images of the mFISH labeling followed by CENP‐B box FISH method used to identify and quantify centromere specific CENP‐B boxes signal in (E). Scale bar represents 10 μm.
-
EBox and whisker plots of normalized CENP‐B boxes intensity over the mean on metaphase spread from three independent experiments (n > 50 cells) using the Tukey plot. One‐way ANOVA with post‐hoc Tukey's multiple comparison test shows high diversity between chromosomes. t‐Test against the mean was used to estimate the statistical significance for each chromosome. **P < 0.01; ***P < 0.001; ****P < 0.0001.
-
F, GScatter plot showing a non‐significant or significant negative correlation between the mean of (F) centromere length (n = 4) and mis‐segregation rate (from Fig 1F) or between the mean of (G) centromere CENP‐B boxes FISH signal (n > 50 cells) and mis‐segregation rate, respectively (r = Spearman rank coefficient). Lines represent the linear regression with a 95% confidence interval. Data from chr 13, 14, 21, and 22 were excluded from the analysis.
