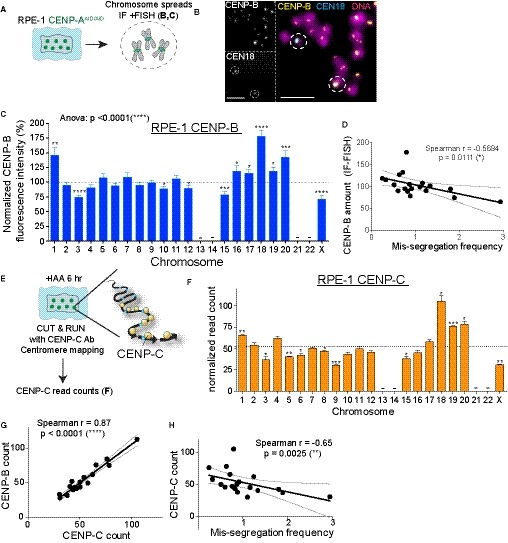
Figure 4. Faithful chromosome segregation is biased in favor of centromeres carrying a high frequency of CENP‐B/CENP‐C molecules.

-
ASchematic of RPE‐1 chromosome spreads used in experiment (B) and (C).
-
BRepresentative immunofluorescence FISH (IF‐FISH) images to measre CENP‐B intensity at specific chromosome in untreated cells. Scale bar represents 5 μm.
-
CBar plot showing the normalized CENP‐B fluorescence intensity at every chromosome over the mean on each metaphase spread (n > 37 per chromosome) ± SEM. Acrocentric chromosomes 13, 14, 21, and 22 were not analyzed and are marked by a line. One‐way ANOVA with post‐hoc Tukey's multiple comparison test shows high diversity between chromosomes. t‐Test against the mean was used to estimate the statistical significance for each chromosome. *P < 0.05; **P < 0.01; ***P < 0.001; ****P < 0.0001.
-
DScatter plot showing a significant negative correlation between the mean of CENP‐B IF‐FISH signal (n > 37) and the mis‐segregation rate (from Fig 1F; r = Spearman rank coefficient). The lines represent linear regression with 95% confidence band.
-
E, FBar graphs report the sum of the normalized read counts of different HOR arrays (see Table EV2) representing CENP‐C binding following CUT&RUN, sequencing, and centromere mapping. Cells were treated for 6 h with IAA to deplete CENP‐A. Error bars represent the SEM of three independent experiments and the dashed line represents the mean. Acrocentric chromosomes 13–14, 21, and 22 were marked by a line. t‐Test against the mean was used to estimate the statistical significance for each chromosome. *P < 0.05; **P < 0.01; ***P < 0.001.
-
GScatter plot showing a significant positive correlation between the mean of CENP‐C reads (n = 3) and CENP‐B reads (n = 3) (r = Spearman rank coefficient). Data from chr 1, 5, and 19 were excluded from the analysis in addition to chr 13, 14, 21, and 22 to better assess correlation without the FISH correction (as in sup Fig EV2I). The lines represent linear regression with a 95% confidence interval.
-
HScatter plot showing a significant negative correlation between the mean of CENP‐C reads (n = 3) and the mis‐segregation rate (from Fig 1F) (r = Spearman rank coefficient). The lines represent linear regression with 95% confidence interval. Data from chr 13, 14, 21, and 22 were excluded from the analysis. The lines represent linear regression with a 95% confidence interval.
