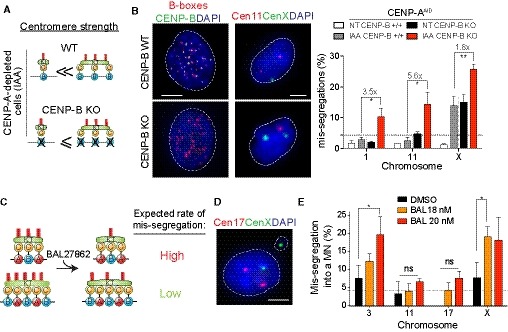
Figure 5. Chromosome‐specific aneuploidy arises following perturbation of centromere strength.

-
ASchematic of the centromere strength model in the RPE‐1 CENP‐AAID CENP‐B KO mutant. After CENP‐A depletion a reduced bias in chromosome mis‐segregation is expected.
-
BRepresentative image of centromere 11 (red) and centromere X (green) FISH on RPE‐1 CENP‐AAID CENP‐B KO mutant in control (top) or IAA‐treated condition (bottom). Scale bar represents 5 μm. Bar graphs show automatic FISH quantification of chromosome mis‐segregation in the indicated cell lines with and without IAA addition for 24 h. Error bars represent the SEM of three independent experiments (n > 200 cells per experiment). Dunnett's multiple comparisons test was used to compare conditions. Gray lines separate independent experiments. Fold changes between gray and red bars are also indicated.
-
CSchematic of the centromere strength model with the microtubule destabilizer BAL27862 compound.
-
DRepresentative image of centromere 17 (red) and centromere X (green) FISH on RPE‐1 cells treated with the BAL27862 compound. Scale bar represents 5 μm.
-
EBars represent the frequency of chromosome mis‐segregation into micronuclei after 28 h treatment with the BAL27862 drug at indicated concentration. Error bars represent the SEM of three independent experiments, dashed line represents the mean. n > 40 micronuclei were analyzed. Dunnett's multiple comparisons test, *P < 0.05. DMSO was used at the same concentration of BAL27862.
