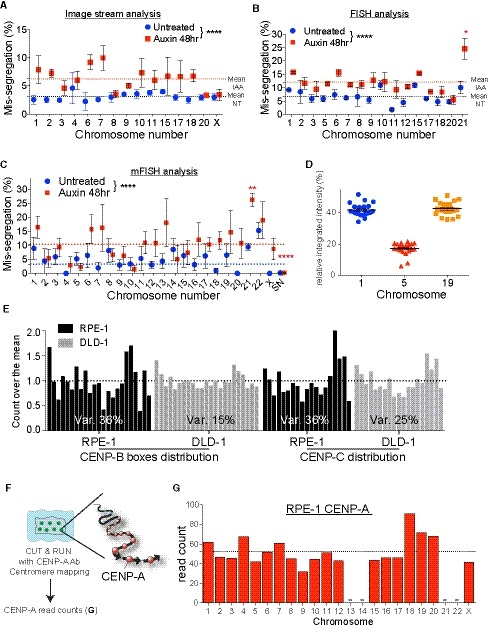
Figure EV5. Chromosome aneuploidy profile of DLD‐1 cells after 48 h of CENP‐A depletion (related to Fig 7).

-
A–CImageStream analysis (A), automated FISH (B) or multicolor FISH (C) of DLD‐1 cells in untreated condition (blue circles) or treated with Auxin for 48 h (red squares). Error bars represent the SEM of 2–4 independent experiments. (see the Dataset EV2 for details). Dashed lines indicate the means of aneuploidy rates in untreated (blue line) or Auxin‐treated (red line) condition. One‐way ANOVA with post‐hoc Tukey's multiple comparison test shows high diversity between untreated and IAA‐treated). Red asterisks (IAA) indicated significant over the respective mean. *P < 0.05; **P < 0.01; ****P < 0.0001.
-
DThe scatter plot represents signal quantification of alpha‐satellite cen1/5/19. Error bars represent the SEM of 22 cells.
-
EHistograms show the normalized distribution of CENP‐B boxes (RPE‐1 n = 4; DLD‐1 from Fig 7F) and CENP‐C (RPE‐1 n = 3; DLD‐1 n = 1) in the indicated cell lines. The coefficient of variation between individual chromosomes is indicated.
-
FSchematic of the experimental procedure used in (G). Ab: Antibody.
-
GBar graph represents the quantification of RPE‐1 CENP‐A counts at each chromosome following CUT&RUN, sequencing and centromere mapping. Dashed line represents the mean (n = 1). Acrocentric chromosomes 13, 14, 21 and 22 are missing and marked by a line.
