-
A
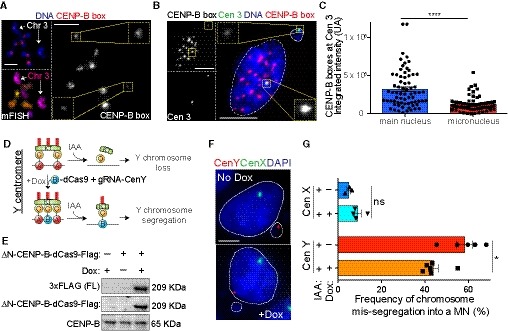
Representative image of CENP‐B box FISH and mFISH stained RPE‐1 metaphase spread cells. Chromosome 3 homologs are indicated by white arrows with single CENP‐B box chromosomes signal magnified in insets. Scale bar represents 5 μm.
-
B
Representative image of CENP‐B box (red) and centromere 3 (green) FISH on RPE‐1 interphase nucleus after 48 h IAA treatment. CENP‐B box signal at individual homologs are magnified in insets. Scale bar represents 5 μm.
-
C
Bar plots represent the quantification of the CENP‐B box FISH intensity at the chromosome 3 homolog contained in the main nucleus versus the homolog present in the micronucleus as represented in (B). Error bars represent the SEM of three independent experiments. n = 69 cells. Unpaired t‐test, ****P < 0.0001.
-
D
Schematic of the experiment shown in (E–G). ΔN‐CENP‐B protein was fused to dCas9‐doxycycline (Dox)‐inducible protein and was inserted at a single genomic locus in DLD‐1 CENP‐A−/EA male cell line expressing a gRNA targeting centromere Y.
-
E
Immunoblot shows expression of the (ΔN)CENP‐B‐dCas9 after doxycycline induction.
-
F
Representative images show a micronucleus or the main nucleus containing the Y chromosome (red) detected by FISH in no‐doxycycline or doxycycline treated cells, respectively. Chromosome X is shown in green. Scale bar represents 5 μm.
-
G
Bar plot shows the mean (n ≥ 3) frequency of micronuclei containing the chromosome Y or chromosome X ± doxycycline treatment for 72 h and IAA for 48 h ± SEM. n > 200 cells with a micronucleus. Mann–Whitney test. *P = 0.0173.

