-
A
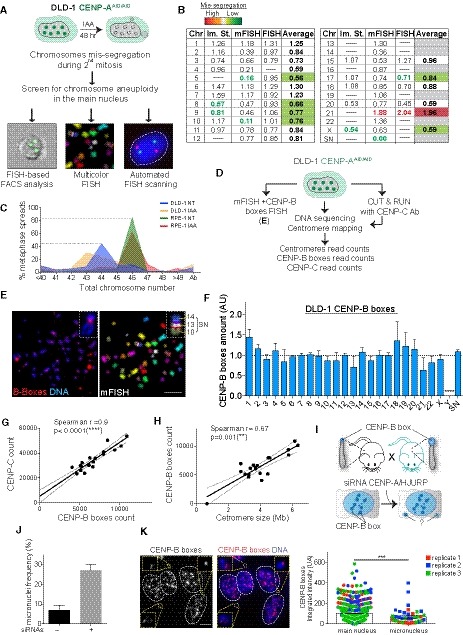
Schematic of the experiment shown in (B).
-
B
Table summarizing whole‐chromosome aneuploidy (fold over the mean) using the indicated methods to measure chromosome mis‐segregation rate. Bold numbers represent significant statistical difference from the mean for each method. Orange to dark red gradient highlights chromosomes that mis‐segregate (with at least one method) at a significantly higher rate compared to the mean level (weak chromosomes). Light green to dark green gradient highlights chromosomes that mis‐segregate (with at least one method) at a significantly lower rate compared to the mean (stronger chromosomes). Data obtained with only one method were excluded. Im. St. = image stream.
-
C
Plot shows the karyotype distribution of DLD‐1 and RPE‐1 cells in untreated or auxin‐treated condition.
-
D
Schematic of the experiment shown in (E).
-
E
Representative image of chromosome spreads in DLD‐1 cells following mFISH and subsequently CENP‐B boxes FISH. Inset shows the supernumerary (SN) chromosome. Scale bar represents 10 μm.
-
F
Bar plot shows the mean variation in CENP‐B boxes in DLD‐1 cells from data from (E) (n = 10 cells) and whole‐genome sequencing and centromere mapping ± SD.
-
G, H
Scatter plot showing a significant positive correlation between the indicated features in DLD‐1 cells (n = 1). The lines represent linear regression with 95% confidence band. Data from chr 13, 14, 21, 22, Y, and SN were excluded from the analysis.
-
I
Schematic of the experiment described in (J) and (K).
-
J
Bars show frequency of micronuclei with or without siRNA treatment. Error bars represent the SEM of three independent experiments (n > 170 cells per replicate).
-
K
(Left) Representative image of CENP‐B box (red) staining after siRNA against CENP‐A/HJURP for 48 h. CENP‐B box signals at individual micronuclei are magnified in insets. Scale bar represent 5 μm. (Right) Bar graph represents the mean of the CENP‐B box FISH intensity contained in the main nucleus versus the one present in the micronucleus ± SEM. Color dots represent independent experiments (n > 43 micronuclei and 840 main nucleus) Mann–Whitney U test: ***P = 0.0001.

