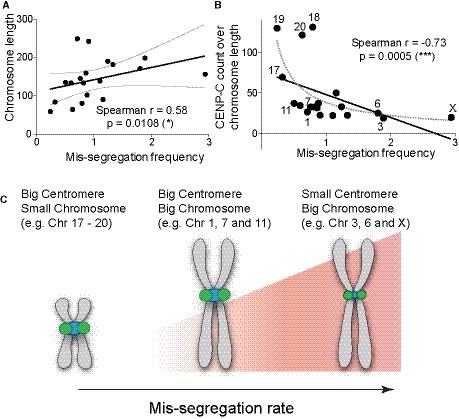
Figure 8. DNA‐dependent centromeric feature and chromosome size influence chromosome‐specific aneuploidy.

-
A, BScatter plot showing (A) a significant positive or (B) a negative correlation between chromosome length and the mis‐segregation rate (from Fig 1F) or CENP‐C (n = 3) reads over chromosome length and mis‐segregation rate (r = Spearman rank coefficient). The lines represent linear regression with 95% confidence interval. Data from chr 13, 14, 21, and 22 were excluded from the analysis. Numbers indicate chromosomes with low or high mis‐segregation frequency.
-
CModel of how chromosome segregation is influenced by centromere size and chromosome length.
