Representative immunofluorescence images of Polo‐phospho(ph)‐T182 levels at KTs of Drosophila neuroblasts throughout mitotic progression. Insets show magnifications of the outlined regions showing kinetochores (KTs) in early prometaphase (EP), late prometaphase (LP) KTs and aligned KTs in metaphase (M). Plotted profiles of signal intensities of phospho(ph)‐T182 and the KT protein Spc105 are shown for the highlighted KTs.
Graph represents the levels of Polo phT182 at KTs for neuroblasts shown in (A). phT182 signal was determined relative to Spc105 and all values normalized to the mean value determined for EP, which was set to 100% (n ≥ 67 KTs from at least 19 neuroblasts for each condition, n = 4 independent experiments).
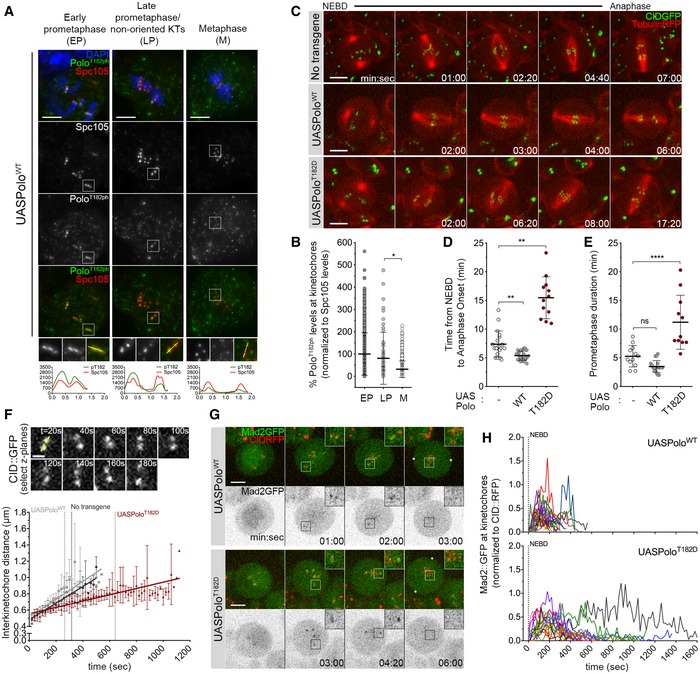
Selected stills from live imaging analysis of mitotic progression in neuroblasts expressing UASPoloWT or UASPoloT182D under the control of inscuteable‐Gal4 driver. Neuroblasts without Polo overexpression were used as control. Mitotic progression was followed in vivo by direct visualization of tubulin‐RFP and the centromere marker CID‐GFP. Time 0 refers to nuclear envelope breakdown (NEBD).
Quantification of the mitotic time (from NEBD to anaphase onset) for neuroblasts shown in (C). NEBD was identified as the time tubulin entered the nuclear space and anaphase onset as the time sister KTs separated (n ≥ 12 neuroblasts for each condition, n ≥ 3 independent experiments).
Quantification of the time spent in prometaphase (from NEBD until last KT alignment at the metaphase plate) for neuroblasts shown in (C) (n ≥ 11 neuroblasts for each condition, n ≥ 3 independent experiments).
Measurement of inter‐kinetochore distance during mitotic progression for neuroblasts shown in (C). Only KT pairs within the maximum of two consecutive z‐planes were considered eligible for quantification. Images were acquired every 20 s. The graph shows the mean distance between two CID centroids in a KT pair over time (t = 0 is NEBD). A linear regression was applied to the data set. Vertical dashed lines highlight the time at which cells overexpressing PoloWT (grey) or PoloT182D (red) reach the average inter‐kinetochore distance measured in metaphase cells without Polo overexpression (black) (n ≥ 7 neuroblasts for each condition).
Selected stills from live imaging of neuroblasts expressing Mad2‐GFP to follow KT‐MT attachment status upon expression of PoloWT or PoloT182D. CID‐RFP was used as KT reference. Insets show magnifications of the outlined regions showing single KT pairs that take longer to align at the metaphase plate. Asterisks indicate direction of chromosome segregation (putative spindle pole positions).
Graph represents the mean fluorescence intensity (MFI) for Mad2‐GFP at KTs measured from NEBD to anaphase onset for neuroblasts shown in (G). Each line represents the average of all KTs measured from a single neuroblast at each time point. Mad2‐GFP MFI was determined relative to CID‐RFP MFI (n ≥ 16 neuroblasts for each condition, n = 5 independent experiments).
Data information: Statistical analysis was calculated using a Kruskal–Wallis test for multiple comparisons.
values: ns, not significant; *< 0.05; **< 0.01; ****< 0.0001. Data are shown as mean ± SD. Scale bar: 5 μm.