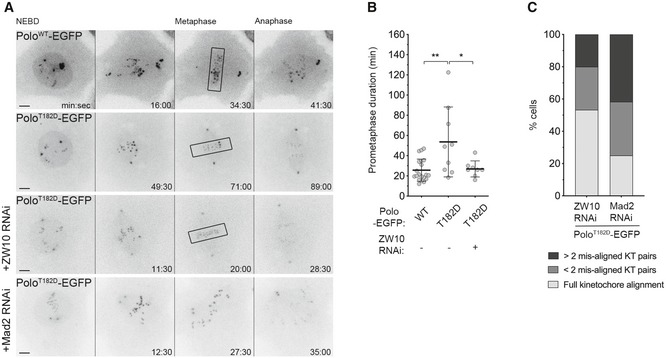
Selected stills from live imaging analysis of mitotic progression in Drosophila S2 cells expressing PoloWT‐EGFP, PoloT182D‐EGFP and PoloT182D‐EGFP in a ZW10‐ or Mad2‐depleted background. Time 0 refers to nuclear envelope breakdown (NEBD). Black box highlights full KT alignment.
Quantification of the time spent in prometaphase (from NEBD until last KT alignment at the metaphase plate) for cells shown in A (n ≥ 8 cells for each condition, n ≥ 3 independent experiments). Note that the Mad2‐depleted cell does not achieve full KT alignment.
Graph represents the percentage of cells that enter anaphase with different levels of KT alignment (n = 15 cells, n ≥ 3 independent experiments).
Data information: Statistical analysis was calculated using a Kruskal–Wallis test for multiple comparisons.
P values: *< 0.05; **< 0.01. Data are shown as mean ± SD. Scale bar: 5 μm.