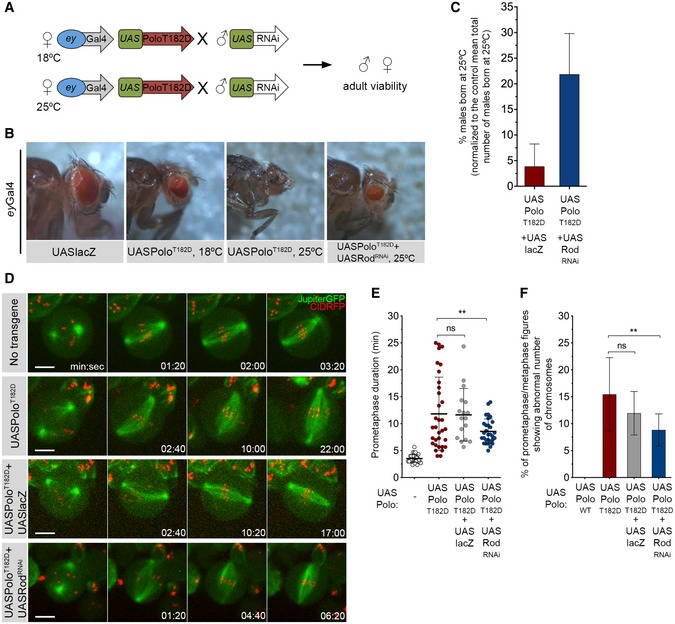
Figure 3. RNAi‐based screen identifies Rod as a suppressor of the PoloT182D phenotype.

- Schematics of the RNAi screen strategy. Females expressing UASPoloT182D under the control of eyless‐Gal4 promoter were crossed with males carrying a specific UAS‐RNAi transgene. Crosses were left either at 18°C or at 25°C, and adult offspring viability was assessed.
- Representative images of the eye phenotype observed in adult flies that were expressing UASPoloT182D in the eye imaginal disc during development at indicated temperatures. An example of an eye from an adult fly co‐expressing UASPoloT182D with UASRodRNAi is also shown. The expression of UASlacZ transgene in the eye imaginal disc was used as control for overexpression and UAS dilution effect.
- Graph represents the mean percentage of males born at 25°C either expressing eyGal4‐driven UASPoloT182D together with UASlacZ or in combination with UASRodRNAi (n ≥ 3 independent crosses for each condition). The number of males with the genotype of interest born in each cross was normalized to the mean total number of males that are born in a control cross (eyGal4 > UASlacZ, n = 9 independent crosses).
- Selected stills from live‐cell imaging of neuroblasts expressing either in UASPoloT182D alone or in Rod‐depleted background (UASPoloT182D + UASRodRNAi). Neuroblasts without transgene expression were used as control, and neuroblasts expressing UASPoloT182D together with UASlacZ were used as control for UAS dilution effect.
- Quantification of the time spent in prometaphase (from NEBD until last KT alignment at the metaphase plate) for neuroblasts shown in (D) (n ≥ 17 neuroblasts for each condition, n ≥ 4 independent experiments). Statistical analysis was calculated using an one‐way ANOVA test for multiple comparisons. P values: ns, not significant; **< 0.01.
- Quantification of the percentage of prometaphase/metaphase mitotic figures per brain showing abnormal chromosome number (> 8 chromosomes (chr) as shown in Fig 2F and G) (n ≥ 360 neuroblasts from at least seven larvae brains for each condition, n ≥ 3 independent experiments). Statistical analysis was calculated using a Kruskal–Wallis test for multiple comparisons. P values: ns, not significant; **< 0.01.
