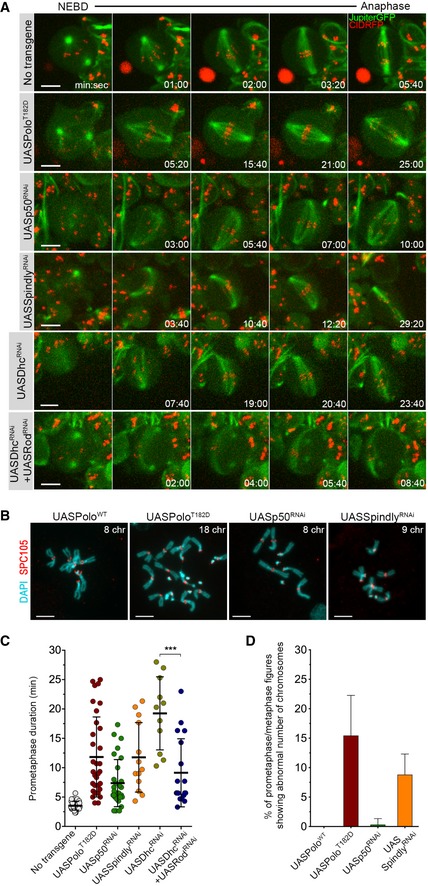
Selected stills from live imaging analysis of mitotic progression in neuroblasts expressing UASPoloT182D, or depleted of p50 (UASp50RNAi), Spindly (UASSpindlyRNAi), dynein heavy chain (UASDhcRNAi) or Rod in Dhc‐depleted background (UASDhcRNAi + UASRodRNAi).
Representative immunofluorescence images of mitotic neuroblasts from squashed brains showing distinct chromosome content. Spc105 was used as a KT reference. Neuroblasts were identified as the larger cells. Chromosome content is shown for each neuroblast.
Quantification of the time spent in prometaphase (from NEBD until last KT alignment at the metaphase plate) for neuroblasts shown in (A) (n ≥ 11 neuroblasts for each condition, n ≥ 6 independent experiments).
Graph represents the % of aneuploidy among mitotic figures for conditions shown in (C). For the quantification of aneuploidy, the whole brain was analysed and prometaphase and metaphase mitotic neuroblasts were scored for chromosome number (aneuploid cell when > 8 chromosomes (chr) were visualized). PoloWT neuroblasts were used as control (n ≥ 305 neuroblasts from at least six larvae brains for each condition, n ≥ 3 independent experiments).
Data information: Statistical analysis was calculated using an unpaired
t‐test (Mann–Whitney).
P values: ***< 0.001. Data are shown as mean ± SD. Scale bar: 5 μm.

