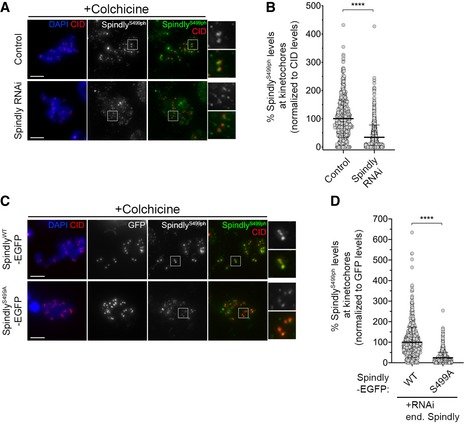
Representative immunofluorescence images of Spindly‐phospho(ph)Ser499 levels at unattached KTs in control Drosophila S2 cells and in Spindly‐depleted cells. Insets display magnifications of the outlined regions. Cells were treated with colchicine prior to fixation to generate unattached KTs. CID was used as a KT reference.
Graph represents the levels of Spindly phS499 at unattached KTs for cells shown in (A). Spindly phS499 levels were determined relative to CID, and all values were normalized to the control mean fluorescence intensity, which was set to 100% (n ≥ 701 KTs from at least 35 cells for each condition, n = 2 independent experiments).
Representative immunofluorescence images of Spindly phS499 levels at unattached KTs in Drosophila S2 cells expressing either SpindlyWT–EGFP or SpindlyS499A–EGFP and depleted of endogenous Spindly. Insets display magnifications of the outlined regions. Cells were treated with colchicine prior to fixation to generate unattached KTs. CID was used as a KT reference.
Graph represents the levels of Spindly phS499 at unattached KTs for cells shown in (C). Spindly phS499 levels were determined relative to GFP, and all values were normalized to the mean fluorescence intensity levels quantified in SpindlyWT–EGFP expressing cells, which was set to 100% (n ≥ 824 KTs from at least 42 cells for each condition, n = 2 independent experiments).
Data information: Statistical analysis was calculated using an unpaired
t‐test (Mann–Whitney).
P values: ****< 0.0001. Data are shown as mean ± SD. Scale bar: 5 μm.

