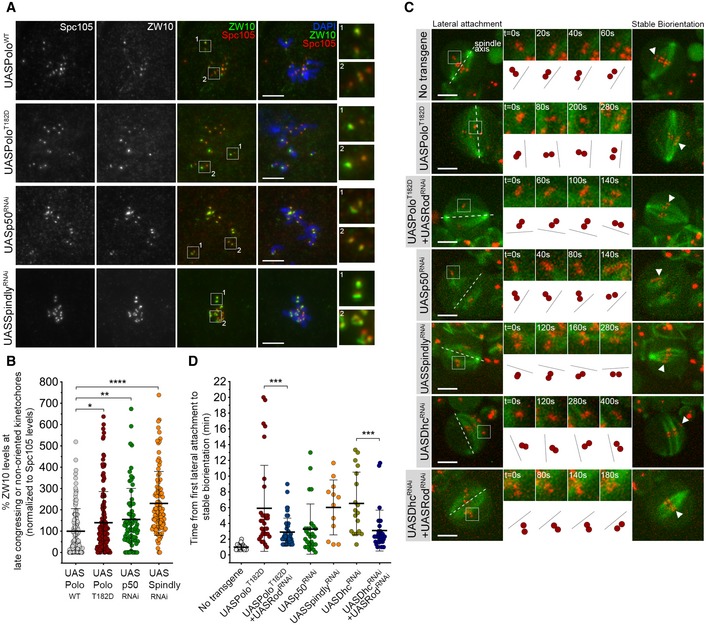
Representative immunofluorescence images of ZW10 levels at unaligned KTs in neuroblasts expressing UASPoloWT, UASPoloT182D or depleted of dynactin subunit p50 (UASp50RNAi) or Spindly (UASSpindlyRNAi). Spc105 was used as a KT reference. Insets display magnifications of the outlined regions which highlight both late congressing KT (inset 1) and sister KTs that are non‐oriented along the spindle axis (inset 2, except for the UASPoloWT panel which displays congressed KTs). UASPoloWT neuroblasts were used as control.
Graph represents ZW10 levels at late congressing and non‐oriented KTs for neuroblasts shown in (A). Cells were selected when most KTs were congressed and late congressing KTs were clearly identified. Similarly, non‐oriented KTs were considered when the KT‐KT axis was not parallel to most congressed KTs (or a metaphase plate). ZW10 signal was determined relative to Spc105, and all values were normalized to the control mean fluorescence intensity, which was set to 100% (n ≥ 69 KTs from at least 19 neuroblasts for each condition, n ≥ 3 independent experiments).
Selected stills from live imaging analysis of KT alignment in neuroblasts expressing UASPoloT182D, either alone or in a Rod‐depleted background (UASPoloT182D + UASRodRNAi), depleted of dynactin (UASp50RNAi), Spindly (UASSpindlyRNAi), dynein (UASDhcRNAi) or Rod in a dynein‐depleted background (UASDhcRNAi + UASRodRNAi). Outlined regions show KTs that are non‐oriented (lateral attachment) relative to spindle axis and that were followed over time until stable biorientation (arrowhead). Cartoon depicts the behaviour of the respective KT pair over successive frames relative to the spindle axis (dashed lines). Neuroblasts without transgene expression were used as control.
Quantification of the time a KT pair takes from the first contact with MTs until stable biorientation for neuroblasts shown in (C) (n ≥ 12 KTs from at least eight neuroblasts for each condition, n ≥ 5 independent experiments).
‐test (Mann–Whitney).
values: *< 0.05; **< 0.01; ***< 0.001; ****< 0.0001. Data are shown as mean ± SD. Scale bar: 5 μm.