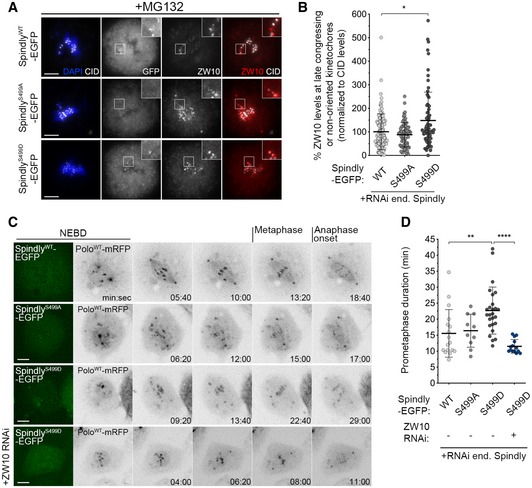
Representative immunofluorescence images of ZW10 localization to unaligned KTs in Drosophila S2 cells expressing either SpindlyWT‐, SpindlyS499A‐ or SpindlyS499D–EGFP. Insets display magnifications of the outlined regions, which highlight late congressing KTs. CID was used as a KT reference.
Graph represents the percentage of ZW10 levels at late congressing and non‐oriented (not oriented parallel to the spindle axis) KTs for cells shown in (A). ZW10 levels were determined relative to CID, and all values were normalized to the control mean fluorescence intensity, which was set to 100% (n ≥ 72 KTs from at least 26 cells for each condition, n = 4 independent experiments).
Selected frames from live imaging analysis of chromosome congression in Drosophila S2 cells expressing SpindlyWT–EGFP, SpindlyS499A–EGFP, SpindlyS499D–EGFP or SpindlyS499D–EGFP in a ZW10‐depleted background. The first frame shows EGFP‐positive cells. Chromosome alignment was followed in vivo by direct visualization of KT‐associated PoloWT‐mRFP signal. Time 0 refers to nuclear envelope breakdown (NEBD), metaphase refers to full KT alignment, and anaphase onset refers to onset of chromosome segregation.
Quantification of the time spent in prometaphase (from NEBD until last KT alignment at the metaphase plate) for cells shown in (C) (n ≥ 10 cells for each condition, n ≥ 2 independent experiments).
Data information: Statistical analysis was calculated using a Kruskal–Wallis test for multiple comparisons.
values: *< 0.05; **< 0.01; ****< 0.0001. Data are shown as mean ±SD. Scale bar: 5 μm.

