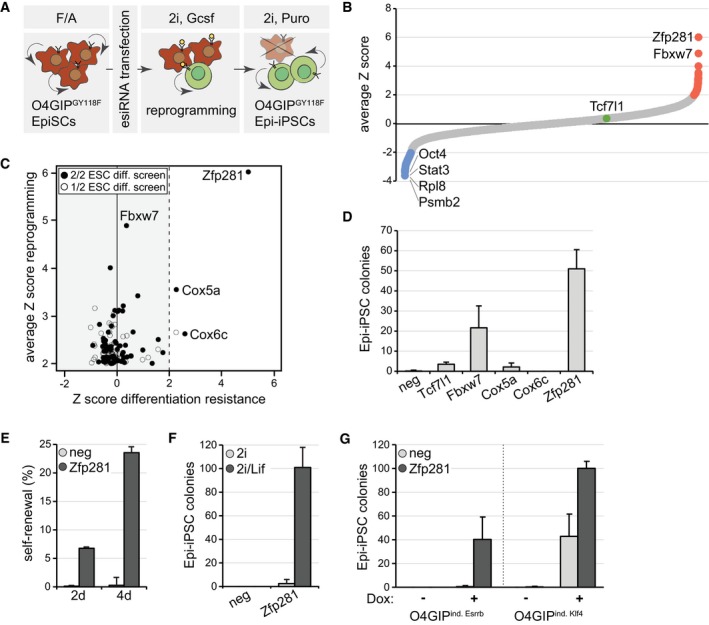
Figure 1. Zfp281 inhibits reprogramming of EpiSCs.

- Schematic outline of the reprogramming screen. Red indicates O4GiPGY118F EpiSCs and green O4GIPGY118F Epi‐iPSCs.
- Average Z scores of the two screen replicates. Note that esiRNAs targeting Mll1 (Zhang et al, 2016a) and Mbd3 (Rais et al, 2013) were not included in our library and that Otx2 (Acampora et al, 2013) scored below the significance threshold. Screen hits with negative (blue) and positive (red) Z scores (red), and Tcf7l1 (green) are highlighted.
- Number of Epi‐iPSC colonies derived from 796.4 EpiSCs transfected with indicated siRNAs, stimulated with Gcsf and 2i for 4 days, and selected with puromycin. Average and standard deviation (SD) of three experiments performed in duplicates. Negative siRNA (neg).
- Self‐renewal of O4GIPGY118F reprogramming intermediates after 2 days or 4 days of stimulation with Gcsf and 2i following transfection with indicated siRNAs. Average and SD of two experiments performed in duplicates.
- Number of Epi‐iPSC colonies derived from OEC2 EpiSCs transfected with indicated siRNAs, treated for 4 days in 2i or 2i/Lif medium, and selected with puromycin. Average and SD of two experiments performed in duplicates.
- Number of Epi‐iPSC colonies derived from O4GIP EpiSCs carrying Dox‐inducible Esrrb or Klf4 transgenes after transfection with indicated siRNAs, stimulation with or without Dox for 2 days, and selection with puromycin. Average and SD of two experiments performed in duplicates.
